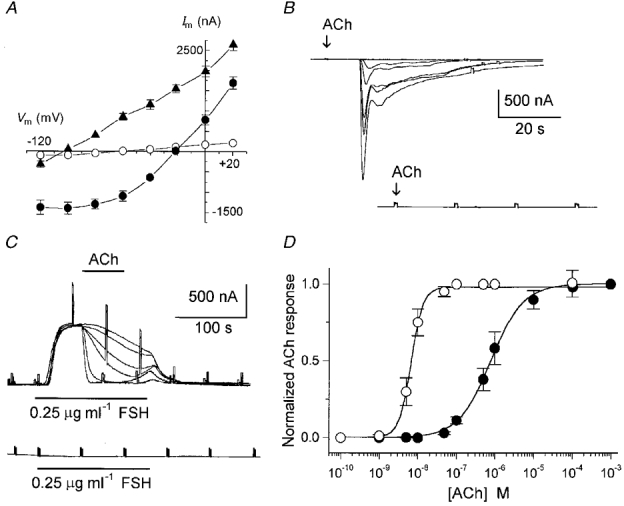
A, membrane current-voltage relationships of
Fin (•) and
IK,cAMP (▴) elicited by FSH (0.25 μg ml
−1), and during
IK,cAMP inhibition (○) by 0.1 μ
m ACh. Each point indicates the mean (±
s.e.m.) from 4-7 follicles (3 frogs) tested in each condition. Reversal potentials for the currents were -21.6 ± 3, -98 ± 2 and -55 ± 9 mV, respectively.
B, top traces: follicular
Fin elicited by ACh applied consecutively at concentrations of 0, 0.05, 0.1, 0.5, 1 and 10 μ
m, with 10 min wash intervals in NR solution. The ACh applications started at the point indicated by the arrow and lasted about 80 s. The superimposed traces are from a single epithelium-removed follicle held at -60 mV. Bottom, 10 μ
m ACh application in a defolliculated oocyte from the same frog.
C, top traces: inhibition of
IK,cAMP (generated by FSH) by increasing concentrations of ACh (0, 1, 5, 10, 50 and 100 n
m, with 15 min wash intervals). Data from 1 follicle held at -40 mV. In this and subsequent records, the bars indicate the time of drug application, and voltage steps of +20 mV (2 s) were applied periodically to monitor membrane conductance. Bottom, FSH application in a defolliculated oocyte from the same frog.
D, dose-response relationships for activation of
Fin (•) and inhibition of
IK,cAMP (○) normalized with respect to the maximal response. Means (±
s.e.m.) of 12-16 follicles from 5 frogs. Curves are fits to the equation:
by the method of non-linear least squares fitting, where EC
50 is the half-maximal effective concentration of ACh,
nH is the slope factor (Hill coefficient),
A1 and
A2 are the initial and final normalized
I values, respectively, and [ACh] is the concentration of the neurotransmitter.

