
Figure 11. Effect of PMA on thapsigargin-evoked [Ca2+]i increase.
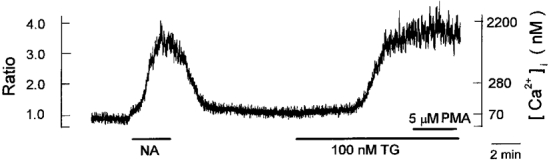
Periods of exposure to 1 μm noradrenaline (NA), 100 nm thapsigargin (TG) and 5 μm PMA are indicated by horizontal bars below chart records of [Ca2+]i. The trace is representative of 6 cells.