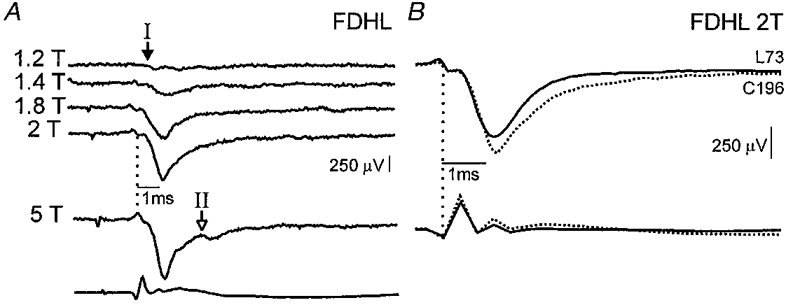
Figure 1. Depression of group I field potentials during fictive locomotion.

A, the 5 top traces are averages (each of 5 traces) of FDHL-evoked control field potentials (negative deflections downward) recorded in L6 at a depth of 2.0 mm. Stimulus strength varied from 1.2 to 5T. Arrows show the onset of the group I (filled arrow) and II (open arrow) components of the fields. The bottom trace is the cord dorsum (negative deflection upward) evoked by 5T stimulation. B, the averaged field potentials and cord dorsum records produced by stimulation of the FDHL nerve at 2T are shown during control (dotted traces) and locomotor (continuous traces) periods. The number of sweeps used to construct the control (C) and locomotor (L) averages are indicated to the right of the averages.
