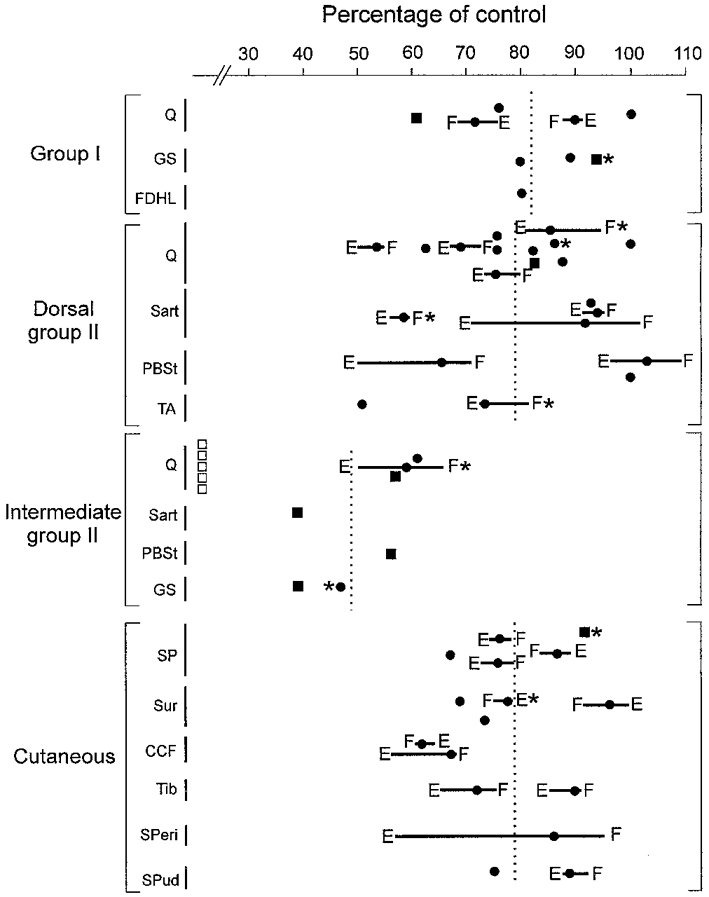
Figure 2. Depression of group I, group II and cutaneous field potentials during fictive locomotion.

The area of each field potential (measured from onset to peak) during fictive locomotion is expressed as a percentage of the pre-locomotor control value prior to MLR stimulation and locomotion. The nerves used to evoke each field are indicated on the left. Horizontal lines indicate the phasic modulation of the field between the extension (E) and flexion (F) phases of the fictive step cycle. The mean values of the field potential reductions for each of the 4 major groupings of fields are indicated by the vertical dotted lines. □, intermediate Q group II fields that became too small to be measured during fictive locomotion; ▪, fields < 100 μV during locomotion not analysed for phasic modulation; * measurements taken following administration of 4-AP.
