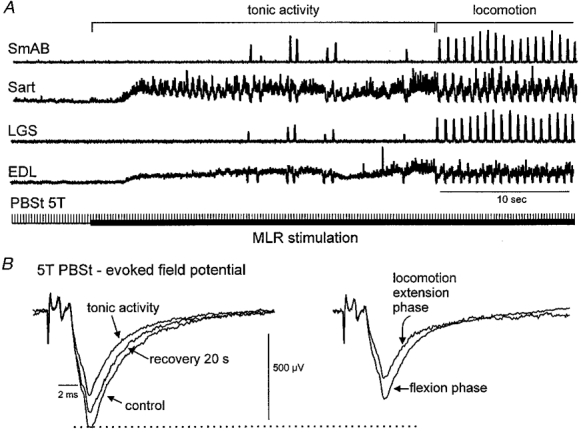
Figure 4. Modulation of a PBSt-evoked dorsal group II field potential during fictive locomotion.

A, integrated, rectified ipsilateral extensor and flexor ENGs before and during MLR stimulation (filled horizontal bar) evoking tonic activity and during fictive locomotion. Stimulation of the PBSt nerve at 5T is indicated by the vertical bars. B, averages of the PBSt-evoked fields (averages from 25–125 traces) recorded at a depth of 1.4 mm in S1 during these periods as well as 20 s after MLR stimulation (recovery). The horizontal dotted line indicates the peak amplitude of the control field.
