
Figure 8. Modulation of whole-cell KATP conductance.
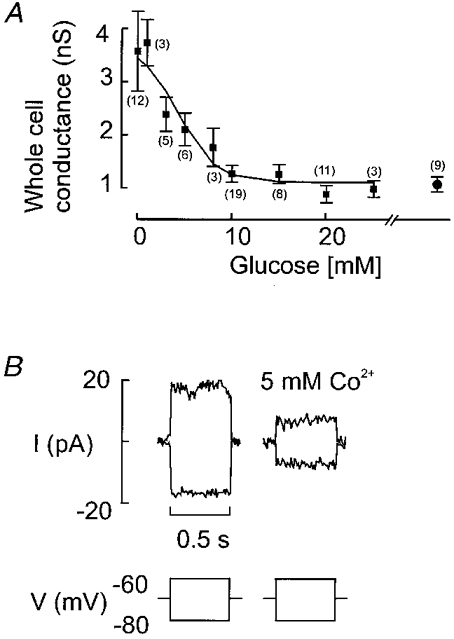
A, relationship between glucose concentration and measured whole-cell conductance calculated from current responses elicited by ±10 mV voltage excursions in Fig. 7B. Values are means ±s.e.m. of the indicated (within parentheses) number of experiments. The rightmost data point indicates the input resistance measured in the simultaneous presence of > 10 mm glucose and 0.1 mm tolbutamide. Note that the whole-cell conductance does not fall below ≈1 nS. B, block of whole-cell KATP conductance by Co2+ (5 mm) applied in the absence of glucose.