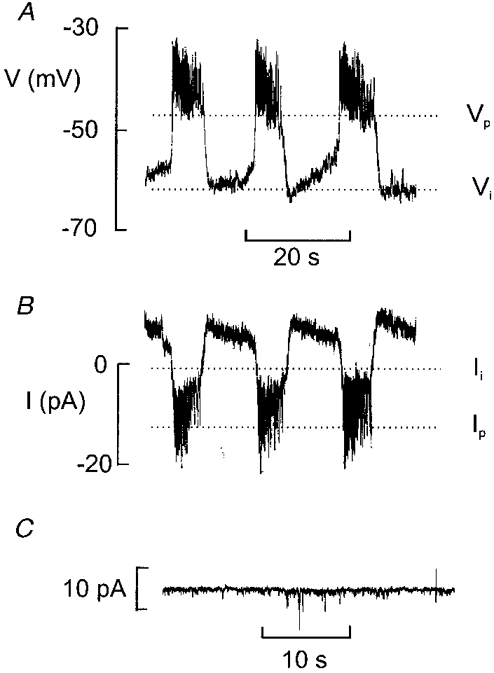
Figure 9. Electrical coupling between different B-cells.

A, glucose-induced electrical activity recorded with 10 mm glucose. Note that the membrane potential undergoes regular oscillations. The maximally negative interburst potential (Vi) and the plateau potential (Vp) are indicated by dotted lines. B, variations of the holding current recorded from the same cell. The variations of the holding current reflect bursts of action potentials in a neighbouring cell. The current levels corresponding to the repolarisation of the burst of action potentials (Ii) and the plateau (Ip) are indicated by dotted lines. C, stable holding current recorded at −70 mV in a non-B-cell in an intact islet exposed to 10 mm glucose.
