
Figure 4. Cell type-specificity of ZNF217 binding.

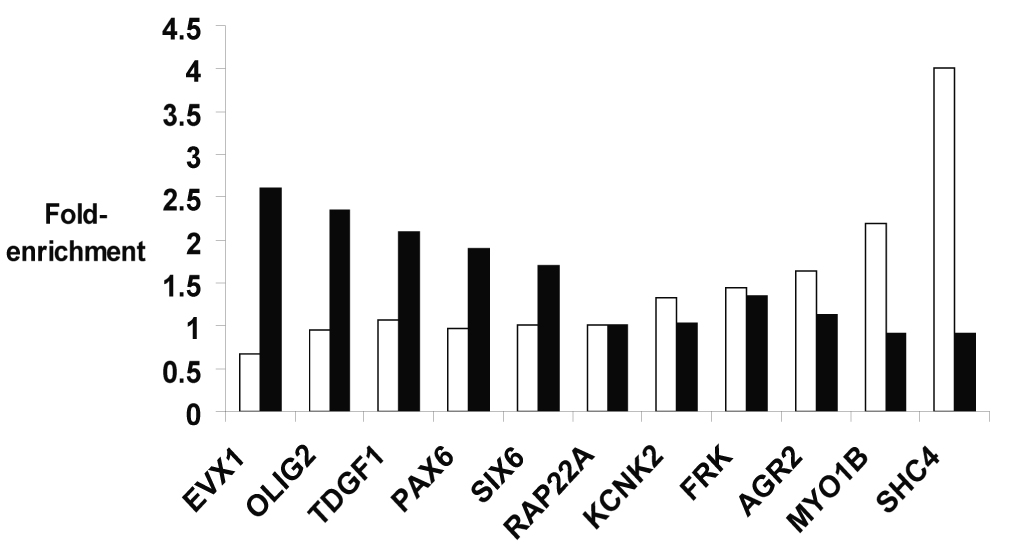
(A) The Maxfour values (see METHODS) are plotted for the ZNF217 ChIP-chip data for MCF7 and Ntera2 promoter1 arrays. The boxes indicate regions used for determination of “Ntera2-exclusive” promoters [values less than 0.3 (log2) in MCF7 and greater than 1.5 (log2) in Ntera2] and “MCF7-exclusive” promoters [values less than 0.4 (log2) in Ntera2 and greater than 1.0 (log2) in MCF7]. For the promoter 2 arrays, the values used to identify “Ntera2-exclusive” promoters were less than 0.3 (log2) in MCF7 and greater than 0.8 (log2) in Ntera2 and the values for “MCF7-exclusive” promoters were less than 0.4 (log2) in Ntera2 and greater than 0.8 (log2) in MCF7; see Supplemental Figure S1 for the promoter 2 comparison graph. (B) Five targets identified to be Ntera2-specific (EVX1, OLIG2, TDGF1, PAX6, and SIX6) and five targets identified to be MCF7-specific (KCNK2, FRK, AGR2, MYO1B, and SHC4) from the ChIP-chip array data were analyzed by PCR using a new set of Ntera2 (black bars) and MCF7 (white bars) ChIP samples. The fold enrichment of each promoter was determined by comparing the signal obtained using 10 ng of the ZNF217 amplicon to the signal obtained using 10 ng of input chromatin; a value of 1.0 is expected for non-target promoters. The enrichment values for the target promoters were normalized to that of a negative control (the RAP22A promoter), which was not enriched for ZNF217 binding in either cell type.