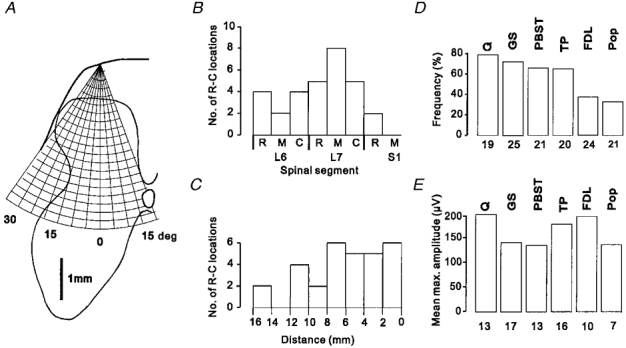
Figure 2. Recording sites, frequency of occurrence and amplitude of group II field potentials.

A, schematic diagram of the procedure used to systematically explore the grey matter in the transverse plane. A grid representing 200 μm steps along a series of electrode tracks made from the same entry point on the cord dorsum but at different angles is superimposed on a representative outline of the grey matter of the lower-lumbar segments (for further details see text). B and C, distribution of 30 rostro-caudal locations at which a systematic exploration of the grey matter in the transverse plane was performed. B, rostro-caudal locations of transverse mapping sites in relation to segmental boundaries; rostral (R), middle (M) and caudal (C) third of the L6-S1 segments. C, rostro-caudal locations of transverse mapping sites in relation to the location of the largest cord dorsum potential evoked by group II afferents of PBST (0 mm). D, relative frequency of occurrence of group II field potentials of different nerves (identified above each bar). Bars represent the percentage of rostro-caudal locations at which field potentials (> 50 μV in amplitude) were detected in any electrode track of the transverse mapping; the number of rostro-caudal locations where the actions of each nerve were investigated is shown underneath each bar. E, mean maximal amplitudes of field potentials evoked by group II afferents of each nerve. These values are calculated from the largest field potentials recorded at each rostro-caudal location, i.e. each transverse mapping site; numbers of potentials from which means were calculated are shown underneath each bar. Data for ABSM have been omitted because no field potentials were detected at any location. (NB, the numbers beneath the histograms in E and D therefore represent, for each nerve, the number of potentials detected (E) following transverse mapping at the number of sites shown in D.)
