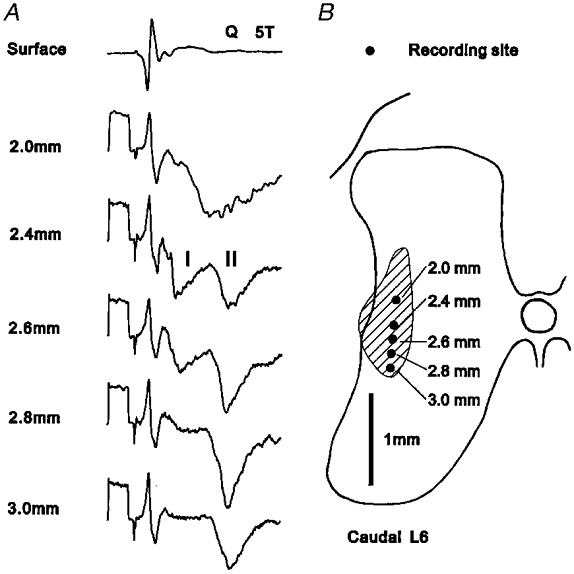
Figure 4. Field potentials evoked by afferents of the quadriceps nerve.

A, potentials recorded at the surface and at different depths within the grey matter following stimulation of the Q nerve at 5T. Field potentials evoked by group I and group II afferents are denoted I and II, respectively. Records are averages of 32 sweeps. Calibration pulse; 1 ms, 200 μV. B, outline of grey matter at caudal L6 on which are indicated the recording sites of the potentials shown in A. The hatched area represents the region within which group II fields of at least 200 μV were evoked.
