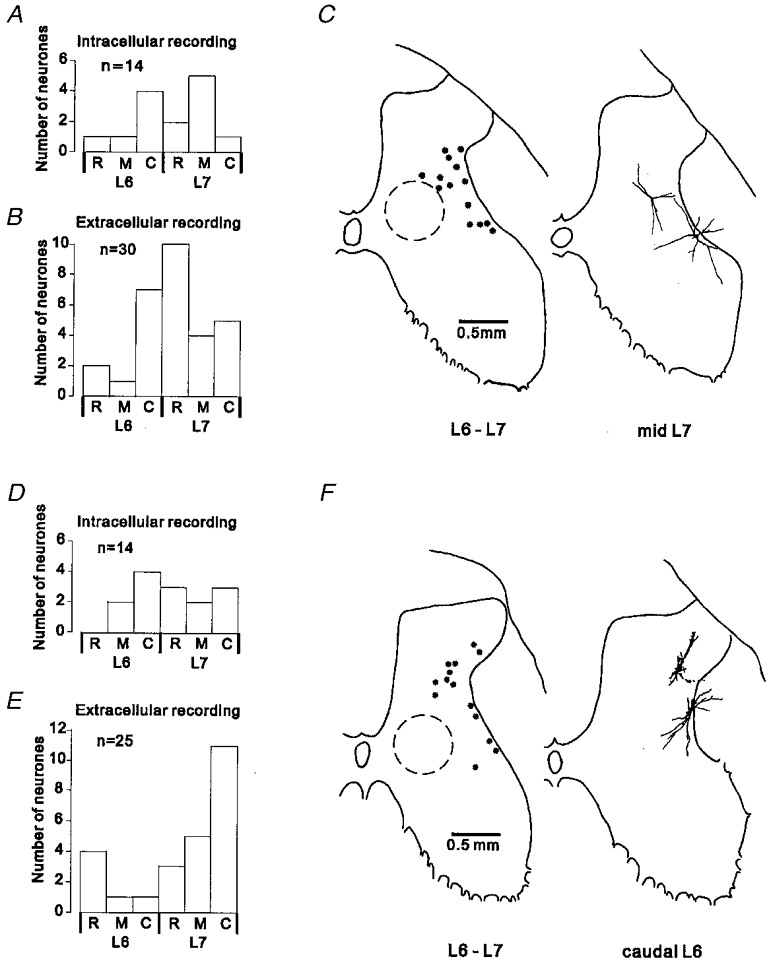
Figure 1. Location of the interneurones investigated.

A and B, rostro-caudal distribution of the sample of interneurones with a projection to L4. The histograms show the number of interneurones recorded in the rostral (R), middle (M) and caudal (C) third of the L6-S1 segments. A, data for intracellularly recorded neurones. B, data for extracellularly recorded neurones (one neurone located in S1 not shown). C, locations of L4-projecting interneurones within the spinal grey matter. The outline on the left shows the locations of intracellularly recorded neurones, reconstructed using information on the recording angle and depth in relation to a marking electrode left in the recording track. Plots from different experiments were superimposed by alignment of the dorsal and lateral borders of the grey matter. The typical location of interneurones receiving excitatory input from group I muscle afferents is indicated by the circle drawn with a dashed line (data from Czarkowska et al. 1981; Jankowska et al. 1981). On the right-hand outline are shown partial reconstructions of two neurones intracellularly labelled with biocytin. D-F, segmental distribution and location within the grey matter of the sample of non-projecting interneurones. Same format as for A-C.
