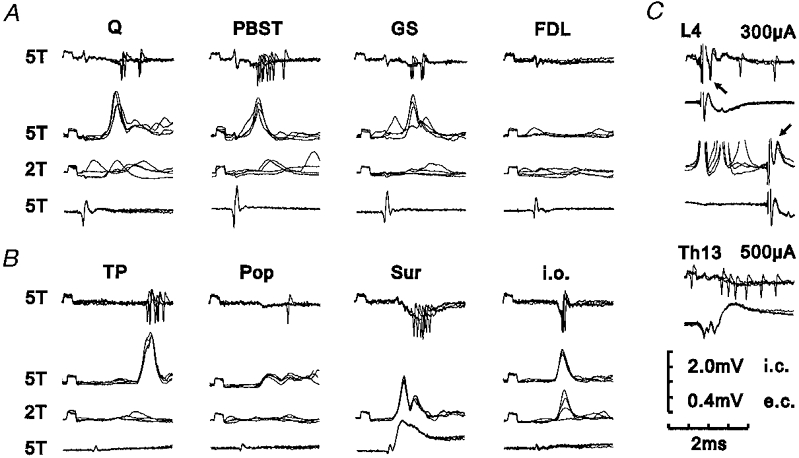
Figure 2. Extracellular and intracellular recordings from an L4-projecting interneurone with excitatory input from group II muscle afferents.

A and B, peripheral input from various muscle nerves and the Sur and i.o. nerves. Each panel of four records shows the effect of stimulation of the peripheral nerve indicated. The upper record of each panel is an extracellular recording of the discharges evoked by stimulation at 5T. The second record shows PSPs evoked by the same stimulation during intracellular recording, the third record shows the effect of reducing the stimulus strength to 2T and the lower record shows the afferent volley. In this and the following figures, negativity is downwards in extracellular and intracellular records from interneurones and upwards for records from the surface of the spinal cord. Note the lack of PSPs following stimulation of muscle nerves at 2T indicating that group II afferents are responsible for the PSPs and discharges evoked at 5T. C, tests of projection. Upper records of each pair are extracellular or intracellular recordings from the interneurone and lower records are from the surface of the spinal cord. The top and middle pairs of records show the antidromic response (indicated by arrows) of the interneurone to stimulation within the lateral funiculus at L4. The top pair of records show an extracellularly recorded antidromic spike and the middle pair of records show a blocked intracellularly recorded antidromic spike. The bottom pair of records show the absence of an antidromic response (extracellular recording) to stimulation at Th13. Each trace is composed of four superimposed sweeps. Calibration scale shows sensitivity for extracellular (e.c.) and intracellular (i.c.) recordings. Recording location, caudal L7.
