
Figure 8. Latencies of discharges and EPSPs evoked in the sample of interneurones by afferents of various nerves.
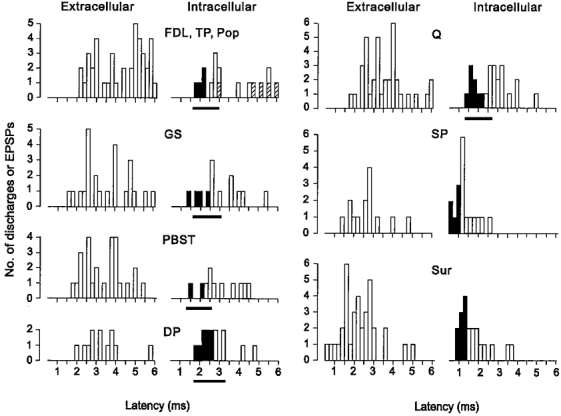
The histograms show the latencies of discharges (Extracellular) and EPSPs (Intracellular) measured from the onset (i.e. peak of the first positive deflection) of volleys in group I muscle afferents or cutaneous afferents. The latencies of discharges and EPSPs evoked from muscle nerves include only those evoked by group II afferents. The filled bars in the intracellular histograms indicate those EPSPs that are considered likely to have been evoked monosynaptically by the very fastest conducting group II afferents of muscle nerves or the fastest conducting cutaneous afferents (see text for further details). The latencies are grouped in 0.2 ms bins. The hatched areas in the histogram of the top left panel indicate EPSPs evoked by Pop group II afferents. The black bars under the histograms for muscle nerves indicate the range of latencies of EPSPs that could be consistent with the monosynaptic actions of the full range of group II muscle afferents (i.e with conduction velocities of 70–35 m s−1). Note, however, that at the longer end of these ranges monosynaptic actions of slowly conducting afferents cannot be distinguished from di- or tri-synaptic actions of faster conducting afferents. A few discharges and EPSPs which occurred at latencies between 6 and 8 ms have been omitted.