
Figure 2. Muscle fibre diameters in untreated and in irradiated sham-implanted soleus muscles.
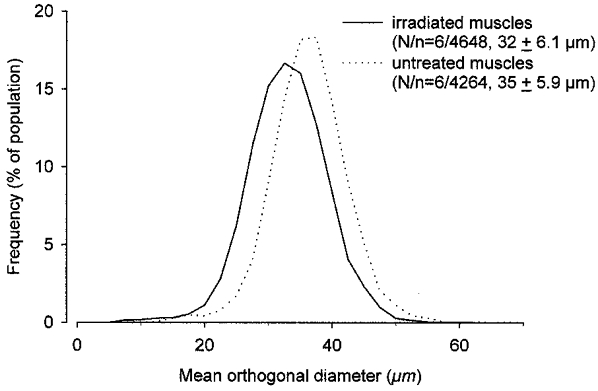
Relative frequency distributions of mean orthogonal diameters (see text for definition) of muscle fibres in the irradiated and sham-implanted right soleus muscles and in the untreated contralateral muscles of Balb/c mice studied 3–4 months after unilateral irradiation. Number of muscles studied (N) and measured muscle fibres (n), as well as group mean values ±s.d. are given in parentheses.