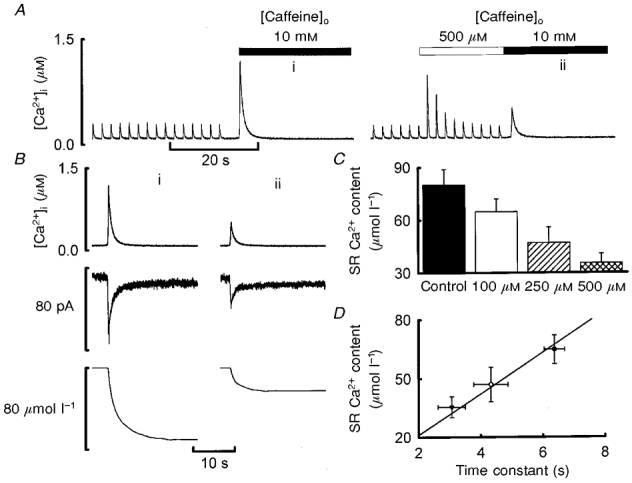
Figure 3. The effects of caffeine (100–500 μm) on SR Ca2+ content.

A, time course. In both parts of the record shown, the cell was first stimulated with 100 ms duration depolarising pulses from −40 to 0 mV at 0.5 Hz. Stimulation was then stopped and 10 mm caffeine applied (filled bar). In the right-hand record, 500 μm caffeine (open bar) was applied for the period shown before addition of 10 mm caffeine. B, measurement of SR Ca2+ content. Traces show (from top to bottom): [Ca2+]i, membrane current, integrated current. The records were obtained from the applications of 10 mm caffeine indicated in A. C, mean data showing the effects of different concentrations of caffeine on SR Ca2+ content. Values are means ±s.e.m. (n = 5 for all concentrations). D, graph of SR Ca2+ content as a function of the time constant of decay of the caffeine-evoked potentiation (see Fig. 2). Each symbol is from a different caffeine concentration (from left to right: 500, 250 and 100 μm).
