
Figure 3. Current-voltage relationships for WT and 4′K mutant 5-HT3A receptors.
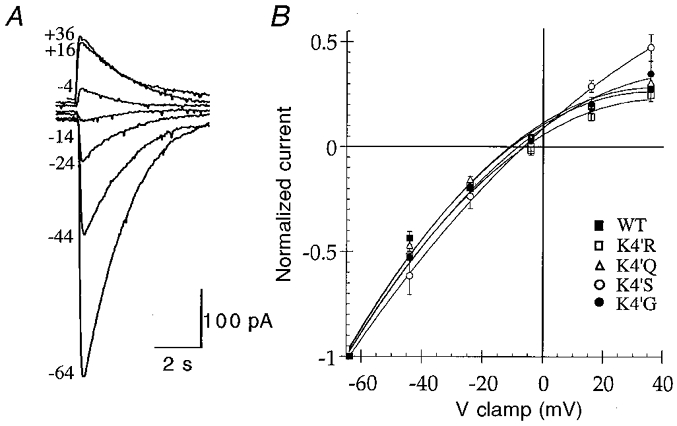
A, sample traces for current-voltage experiments conducted on the WT 5-HT3A receptor. 5-HT-evoked (10 μm, 2 s) whole cell responses were recorded at the holding potentials indicated to the left (mV). Traces are from one experiment and are representative of four others. B, I–V curves for WT and 4′K mutant 5-HT3A receptors were constructed by measuring the peak inward current evoked by 10 μm 5-HT, at the holding potentials (mV) shown (n = 4). The reversal potentials estimated from these data are given in Table 1.