
Figure 6. Estimation of the single-channel conductance of the WT and 4′K mutant 5-HT3A receptors.
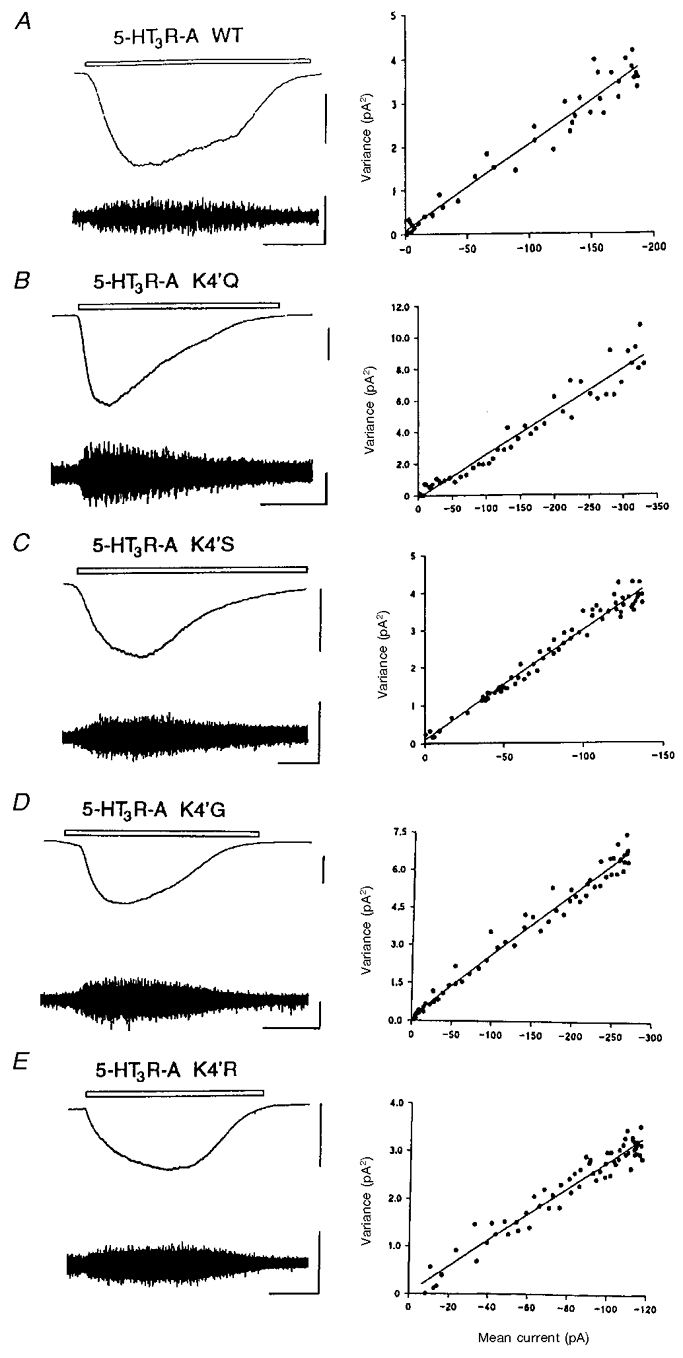
Examples from single cells of low-gain DC-coupled records (top left trace in each panel) and high-gain AC-coupled (1–1000 Hz bandwidth) records (bottom left trace in each panel) of inward currents evoked by application of 1 μm 5-HT applied by microperfusion for the period indicated (open bar) to HEK 293 cells expressing WT (A), K4′Q (B), K4′S (C), K4′G (D) and K4′R (E) 5-HT3 receptors. The vertical scale bars represent 100 and 5 pA for the DC- and AC-coupled traces, respectively. The horizontal calibration bar represents 20 s. The holding potential in all experiments was −60 mV. In each case the right panel represents the relationship between the variance of the AC-coupled current (pA2, vertical axes) and the DC amplitude (pA, horizontal axes) throughout the 5-HT-evoked response after background current variance in the absence of 5-HT has been subtracted. The slope of the line fitted to the data points, by linear regression analysis, provides an estimate of the underlying unitary conductance. In the examples shown above, the single-channel conductance (γ) was estimated to be 346, 473, 509, 428 and 484 fS for the WT, K4′Q, K4′S, K4′G and K4′R receptors, respectively.