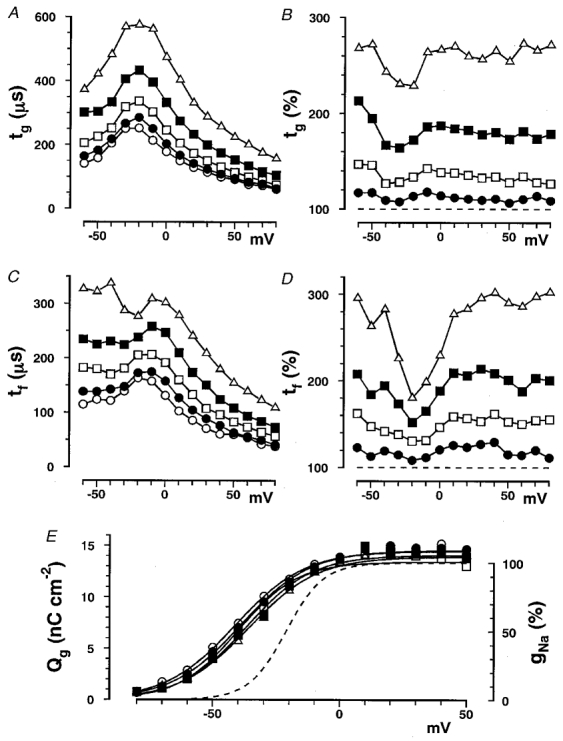
Figure 2. The voltage dependence of gating current time constants and Qg in glucose solutions.

A, tg plotted as a function of membrane potential in glucose solutions at concentrations of 0 (○), 0.5 (•), 1 (□), 1.5 (▪) and 2 M (▵). Averaged values obtained from 12 experiments are plotted. The standard deviations (s.d.s) are not indicated for clarity. Percentage errors are defined by the ratio (in %) of s.d. to the mean. The averaged percentage errors at membrane potentials between −30 and +30 mV at glucose concentrations of 0, 0.5, 1, 1.5 and 2 M were 9, 8, 8, 11 and 11%, respectively, and those between −60 and +80 mV were 14, 12, 11, 14 and 15%, respectively. B, the percentage change in tg plotted as a function of membrane potential in glucose solutions at concentrations of 0.5 (•), 1 (□), 1.5 (▪) and 2 M (▵). The dashed horizontal line indicates 100%. The percentage changes were obtained for each experiment and then averaged in 12 experiments. Percentage errors averaged between −30 and +30 mV at glucose concentrations of 0.5, 1, 1.5 and 2 M were 7, 8, 11 and 11%, respectively, and those between −60 and +80 mV were 13, 14, 17 and 19%, respectively. C, tf plotted as a function of membrane potential in glucose solutions at concentrations of 0 (○), 0.5 (•), 1 (□), 1.5 (▪) and 2 M (▵). Averaged values obtained from 12 experiments are plotted. The averaged percentage errors at membrane potentials between −30 and +30 mV are at glucose concentrations of 0, 0.5, 1, 1.5 and 2 M were 16, 15, 14, 18 and 23%, respectively, and those between −60 and +80 mV were 20, 13, 15, 18 and 22%, respectively. D, the percentage change in tf plotted as a function of membrane potential in glucose solutions at concentrations of 0.5 (•), 1 (□), 1.5 (▪) and 2 M (▵). The dashed horizontal line indicates 100%. The percentage changes were obtained for each experiment and then averaged in 12 experiments. Percentage errors averaged between −30 and +30 mV at the glucose concentrations of 0.5, 1, 1.5 and 2 M were 19, 17, 22, and 27%, respectively, and those between −60 and +80 mV were 20, 19, 22 and 27%, respectively. E, total charges (Qg) obtained by integrating gating current traces are shown on the left-hand ordinate and are plotted as a function of membrane potential in glucose solutions at concentrations of 0 (○), 0.5 (•), 1 (□), 1.5 (▪) and 2 M (▵). Data were averaged and fitted with eqn (1) with Qg,0 = 0. Values of V½ at concentrations of 0, 0.5, 1, 1.5 and 2 M were −40, −38, −38, −34 and −34 mV, respectively. Original data in each experiment were fitted with eqn (1) and values of V½, z and Qg,∞ from 12 experiments were averaged; averaged values are listed in Table 1. The dashed line shows a typical gNa-V curve, in which gNa (in %) on the right-hand ordinate is plotted against the membrane potential.
