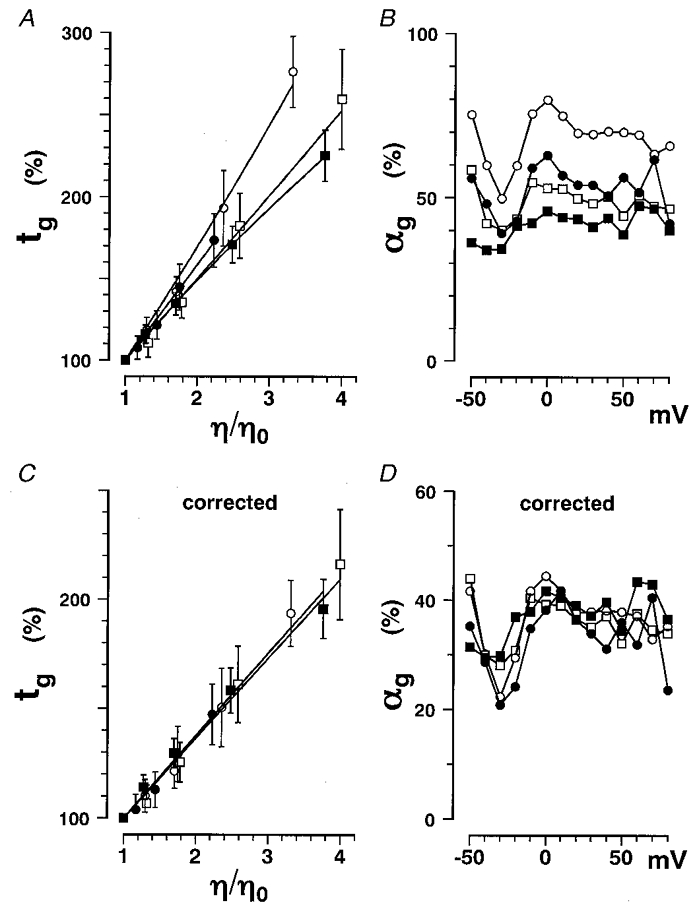
Figure 3. Gating current time constants as a function of viscosity.

Data obtained in glycerol (○), erythritol (•), glucose (□) and sucrose (▪) solutions are plotted. A, the percentage change in tg at +20 mV is plotted as a function of η/η0. The averaged values from 12 experiments are plotted with s.d. values (vertical bars). Data were fitted with eqn (18) in place of eqn (2) to show a detectable non-linearity. B, αg values obtained by fitting the tg-η/η0 curve in Fig. 3A with eqn (2) are plotted as a function of membrane potential. C, the tg data in A were corrected using eqn (8) with δg fixed at 0.05 l osmol−1 and are plotted as a function of η/η0 (corrected tg-η/η0 curve). The corrected data could be fitted with eqn (2) better than the original data in A.D, αg values obtained by fitting the corrected tg-η/η0 curve in C with eqn (2) are plotted as a function of membrane potential.
