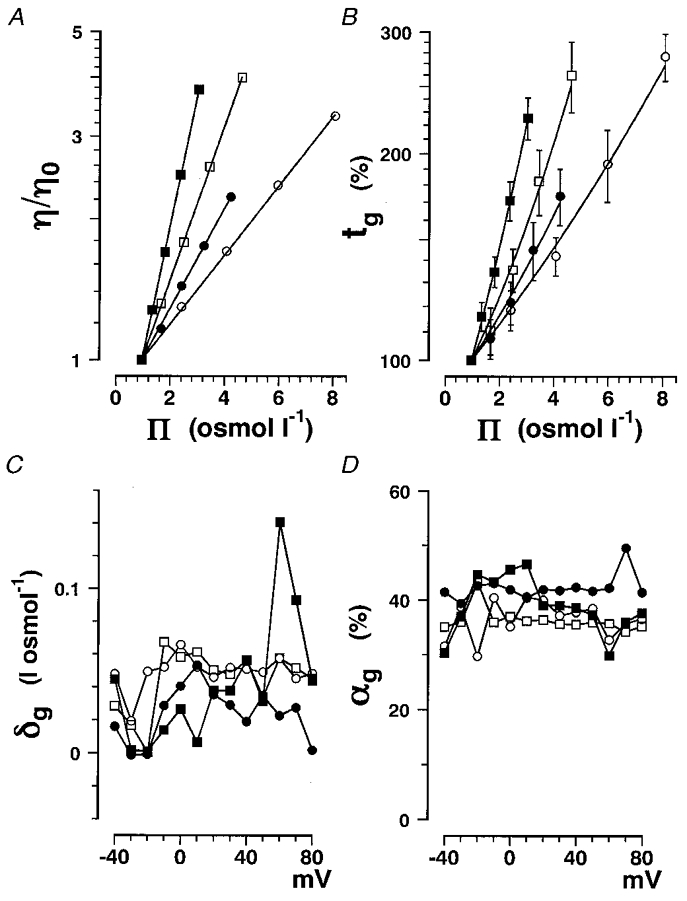
Figure 4. The gating current time constants as a function of solution osmolarity.

Data obtained in glycerol (○), erythritol (•), glucose (□) and sucrose (▪) solutions are plotted. A, η/η0 is plotted on a logarithmic scale as a function of solution osmolarity for the different non-electrolytes. The data are fitted with eqn (16). The p values obtained are listed in Table 2. B, the percentage change in tg at +20 mV plotted as a function of Π. The same data as in Fig. 3A are plotted with s.d. values (vertical bars). The data were fitted with eqn (17) and then αg and δg for the four different non-electrolytes were derived. C, δg plotted as a function of membrane potential. D, αg plotted as a function of membrane potential.
