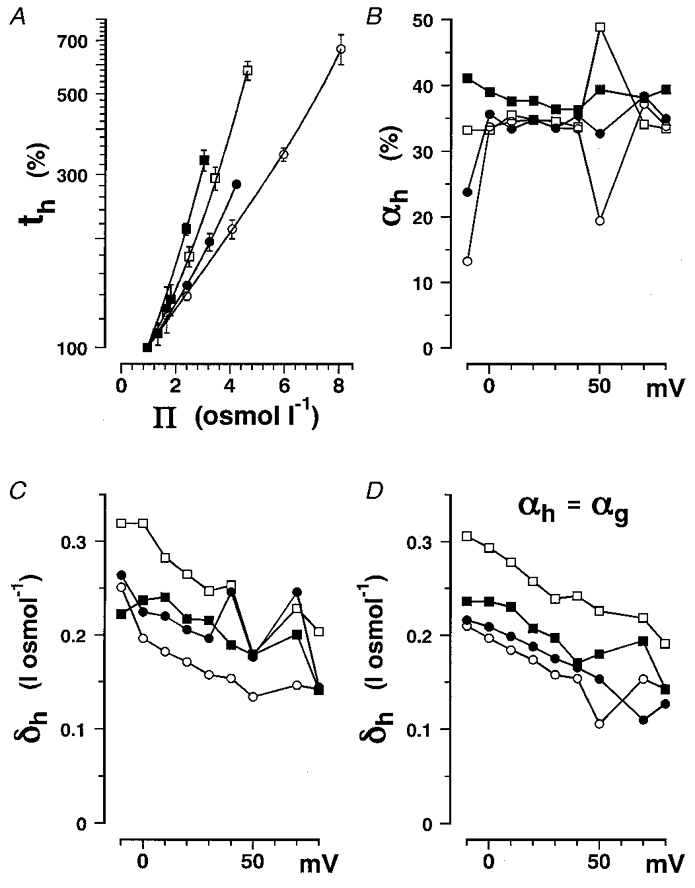
Figure 6. The inactivation time constant in non-electrolyte solutions as a function of solution osmolarity.

Data obtained in glycerol (○), erythritol (•), glucose (□) and sucrose (▪) solutions are plotted. A, percentage change in th at +20 mV plotted as a function of Π. The data are plotted with s.d. values (vertical bars). Data were fitted with eqn (17), and then αh and δh for the four different non-electrolytes were obtained. B, αh plotted as a function of membrane potential. C, δh plotted as a function of membrane potential. D, δh obtained by fitting the data with eqn (17) with αh fixed equal to the averaged value of αg (Table 2), as in Fig. 5D, plotted as a function of membrane potential.
