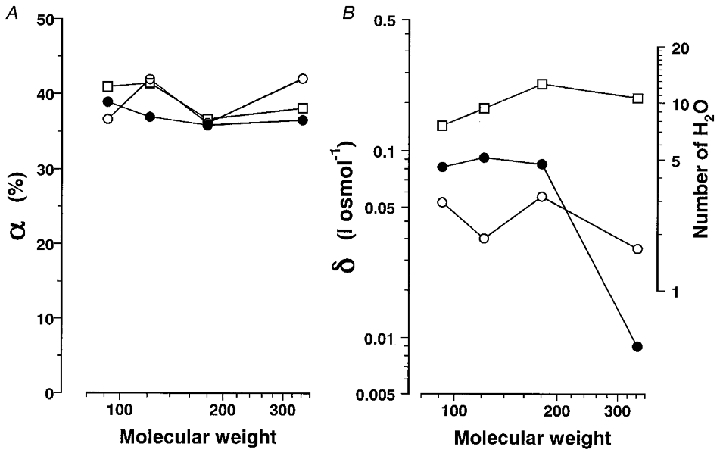
Figure 7. Molecular weight dependence of α and δ.

A, αg (○), αp (•) and αh (□) (in %) plotted as a function of molecular weight on a logarithmic scale. B, δg (○), Δδp (•) and Δδh (□) (in l osmol−1) on a logarithmic scale (left-hand ordinate) are plotted as a function of molecular weight on a logarithmic scale. The number of water molecules contributing the transient hydration during each process was obtained assuming the volume of water to be 18 ml mol−1 (0.03 nm3 per molecule) and is shown on the right-hand ordinate.
