
Figure 1. Mitochondria in a Bufo marinus gastric myocyte labelled with rhod-2.
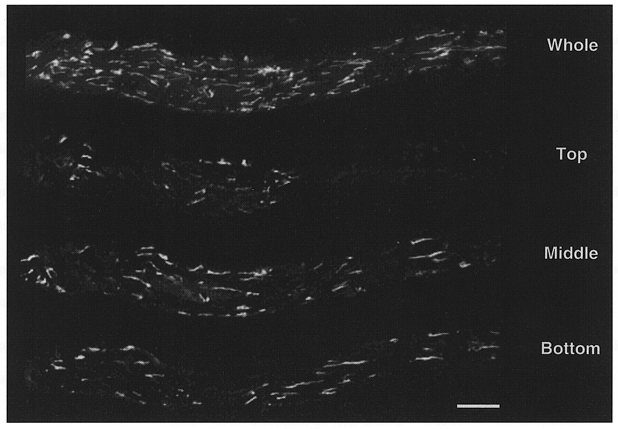
Smooth muscle cells were loaded with 1–1.5 μM rhod-2 AM for 1 h. The positive charge on rhod-2 AM results in significant accumulation of this indicator within the mitochondrial matrix. Following hydrolysis of the acetoxymethylester group, rhod-2 becomes trapped in the mitochondrial matrix. The image showing the whole cell reflects a maximum intensity projection of the entire through-focus data set. The images labelled top, middle and bottom reflect 0.25 μm optical sections from the respective locations within the cell. The cell was imaged using a digital imaging microscope (Moore et al. 1993) and processed using a constrained deconvolution algorithm (Carrington et al. 1990). Scale bar represents 10 μm.