
Figure 6. Subcellular imaging of the increase in mitochondrial [Ca2+] during caffeine-induced release of Ca2+ from the SR.
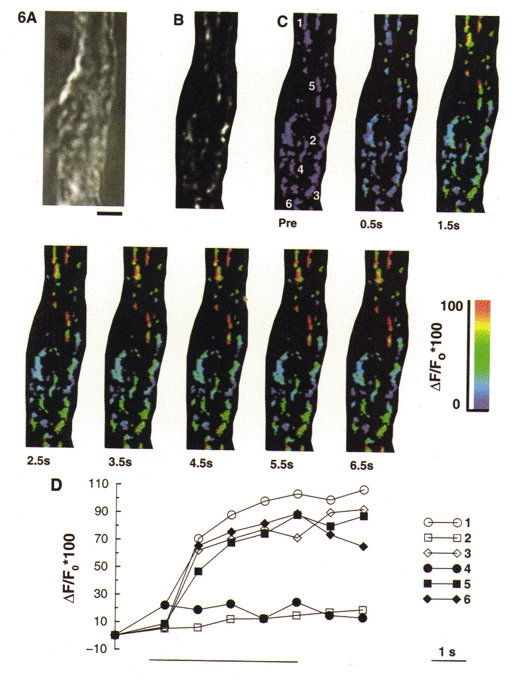
Smooth muscle cells were loaded with 1–1.5 μM rhod-2 AM for 1 h to enable monitoring of [Ca2+]m. A, bright field image of a Bufo marinus gastric smooth muscle cell from which the subsequent fluorescence images in this figure were obtained. Scale bar represents 5 μm and is applicable to all the images shown. B, grey scale image of rhod-2 labelled mitochondria. This image represents a 1.5 μm thick optical section of the through-focus data set. C, pseudocolour images of the same optical section as shown in B during a 5 s application of caffeine (20 mM). ‘Pre’ indicates the image acquired before application of caffeine. D, rhod-2 fluorescence for the six individual mitochondria numbered in the first image of C, selected from regions close to the membrane (open symbols) or more centrally located (filled symbols). Each mitochondrion is represented by the fluorescence of its brightest pixel, and was normalized to the pre-stimulation value. The bar beneath the graph indicates the period of caffeine application.