
Figure 8. Simultaneous measurement of cytoplasmic [Ca2+] and mitochondrial membrane potential during depolarizing stimulation.
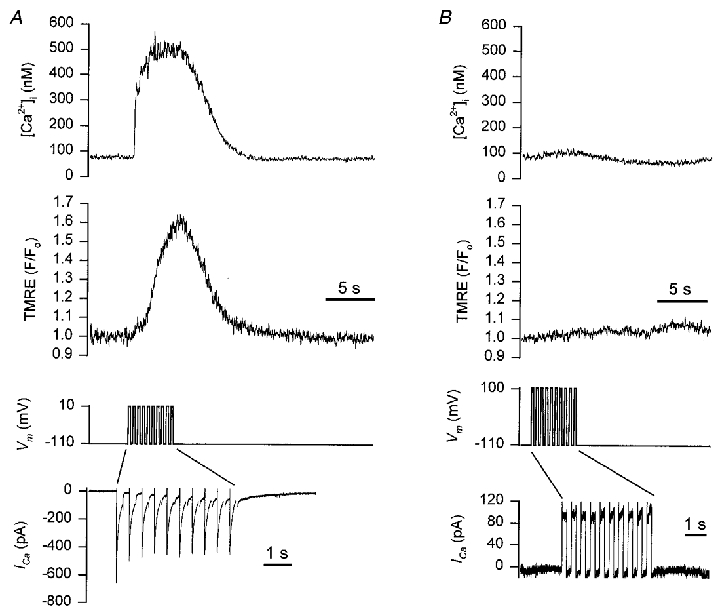
Smooth muscle cells were loaded with 100 nM TMRE for 10 min to enable monitoring of the mitochondrial membrane potential. Fura-2 was included in the patch pipette to allow simultaneous monitoring of [Ca2+]i. A, representative recording showing: top trace, the [Ca2+]i transient during a 5 s train of depolarizing pulses (from −110 to +10 mV, 250 ms duration, 2 Hz); middle trace, the corresponding change in mitochondrial membrane potential. An increase in TMRE fluorescence signals depolarization of the mitochondrial membrane potential; bottom traces show the membrane potential and the membrane current, during the depolarizing train. Note the change in the time scale for the membrane current. B, the same cell as shown in A, with the membrane potential in this sequence pulsed to +100 mV during the depolarizing train.