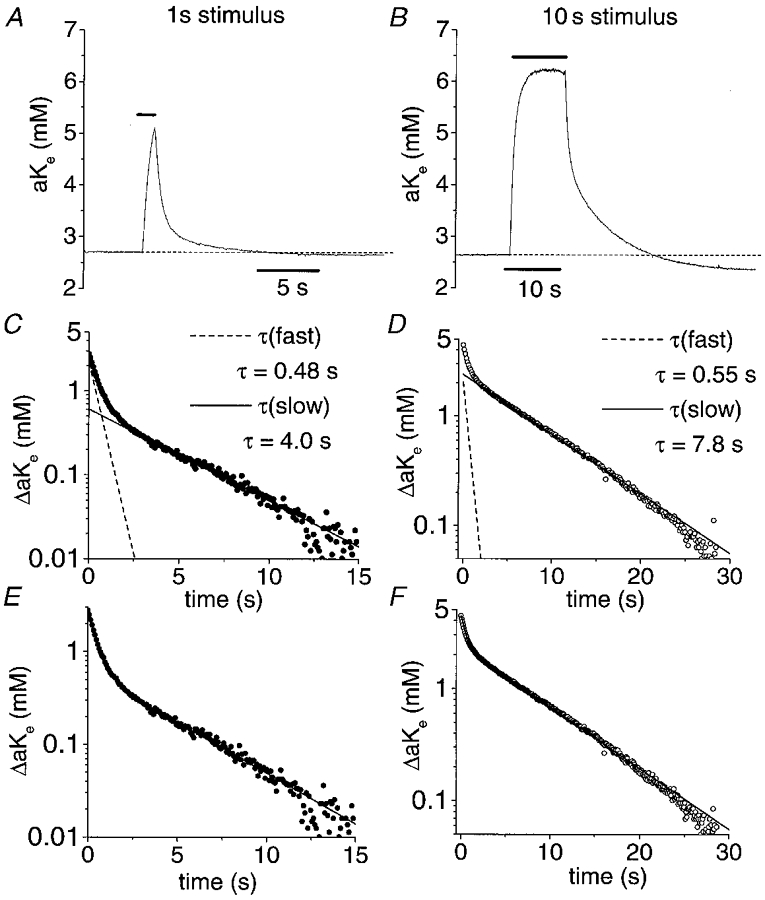
Figure 2. Recovery of [K+]o increase following a stimulus train in rat optic nerve follows a double-exponential time course.

A, change in [K+]o following a 1 s stimulus train at 100 Hz (temperature, 37 °C). The horizontal bars indicate the period of stimulation in this and subsequent figures. B, change in [K+]o following a 10 s stimulus train at 100 Hz. C, semilogarithmic plot of the decay phase of a representative [K+]o transient following a 1 s, 100 Hz stimulus (•; from the data in A). Two distinct phases of [K+]o decline can be seen: an early, rapid decline and a later, slower decline. Two exponential components contribute to this decay and are plotted individually with the data. The decay phase has a fast time constant, τfast, of 0.48 s and a slow time constant, τslow, of 4.0 s following a 1 s stimulus. D, semilogarithmic plot of the decay phase of an [K+]o transient following a 10 s, 100 Hz stimulus (○; from the data in B). As with the decline of [K+]o following a 1 s stimulus, the [K+]o decay following a 10 s stimulus consisted of two components (individually illustrated as in C). τfast was 0.55 s and τslow was 7.8 s. The starting amplitude of τfast was relatively invariant as stimulus duration was increased from 1 to 10 s while the starting amplitude of τslow increased; the relative amplitude of τslow in the fits to the data in C and D was 0.25 and 0.55, respectively. E, semilogarithmic plot of the decay phase from the data illustrated in A. The sum (continuous line) of the individual components illustrated in C provides an excellent fit of the data. F, semilogarithmic plot of the decay phase from the data illustrated in B. The sum of the individual components illustrated in D (continuous line) provides an excellent fit of the data. The number of data points in the decay phase plots (C–F) has been reduced for clarity in this and subsequent figures.
