
Figure 3. Relationship of the time constants for the two components of [K+]o recovery, τfast and τslow, to the magnitude of activity-dependent changes in [K+]o and to stimulus duration.
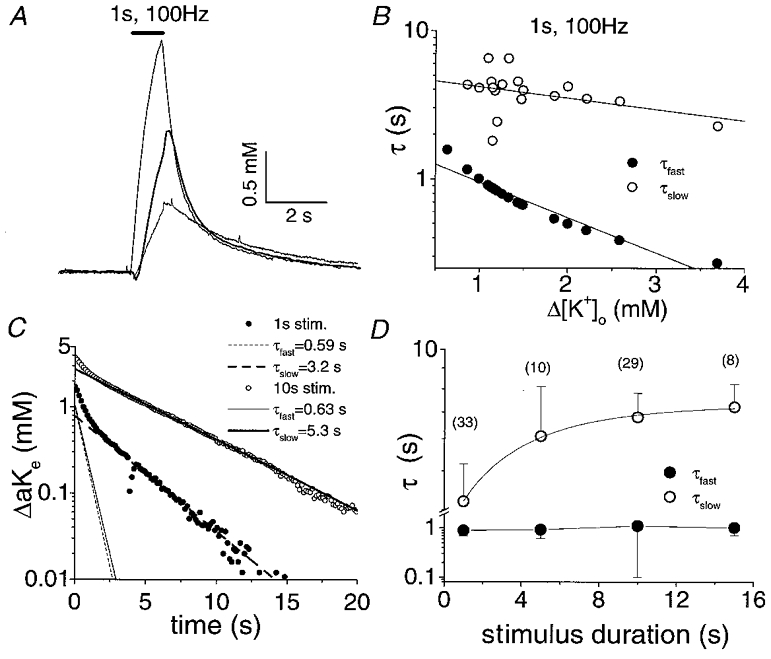
A, [K+]o transients from three different nerves in response to a 1 s, 100 Hz stimulus at 37 °C. The early phase of [K+]o recovery accelerates with increases in the size of the evoked [K+]o increase. B, time constants of [K+]o recovery from 21 nerves following a 1 s, 100 Hz stimulus plotted against the peak increase in [K+]o produced with each stimulus. τfast became shorter as a function of Δ[K+]o. The linear fit to τfast had a slope of −0.24 with a regression coefficient of 0.96. τslow was minimally affected by the magnitude of Δ[K+]o. The linear fit to τslow had a slope of −0.08 with a regression coefficient of 0.38. C, decay phases of [K+]o following a 1 s (•) and a 10 s (○) stimulus train from a representative nerve. Simulations of the individual exponential components of post-stimulus recovery of [K+]o are plotted on the same graph. The amplitude and τ of the fast component, but not the slow component, were unaffected by stimulus duration. D, time constants of [K+]o recovery (means ±s.d.) versus stimulus duration. τslow increased with stimulus duration but τfast was relatively invariant. Numbers in parentheses indicate the number of nerves each data point represents.