
Figure 5. Time course of the computation-induced increase in the Ia afferent response.
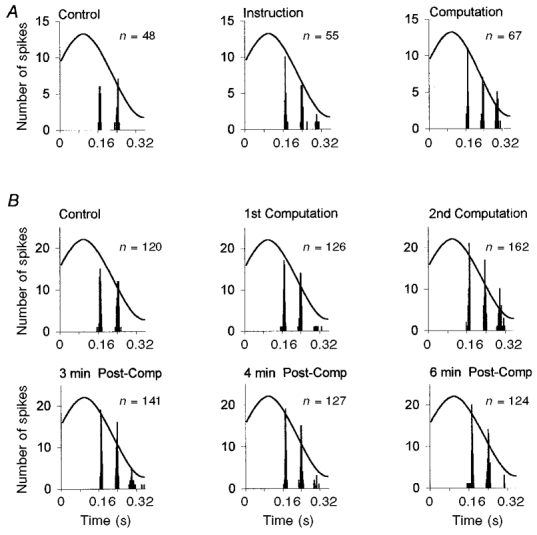
A, the 3 cycle histograms reflect the sensory response to 24 cumulated stretch movements while the subject was relaxed (left), listening to the computation instructions (middle), or performing mental computation (right). Although the two-spike response was stable during the control period (total number of spikes (n) = 48), a third spike occurred in some cycles while the subject was listening to the instructions (55 spikes) and especially during the actual computation (67 spikes). B, the activity of the same primary afferent was analysed during a different recording sequence. The upper 3 cycle histograms show the sensory response during 60 cumulated imposed stretch movements, during the control period and during the performance of 2 successive mental computations. The number of spikes gradually increased during the performance of the mental computation. The 3 lower cycle histograms show the sensory responses 3, 4 and 6 min after the subject had been asked to relax. The control response was gradually restored during the 6 min following the request.