
Figure 4. Comparison of the effects of flufenamic acid (FFA) and niflumic acid (NFA) on Ic and MG channels.
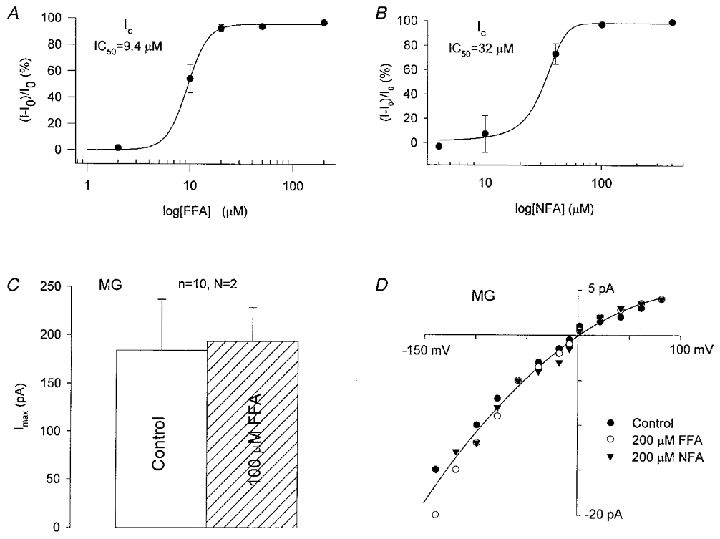
A and B, dose-inhibition curves for the block of Ic by FFA and NFA measured in Ca2+-free Ringer solution. Data points show percentage inhibition. The continuous lines are best fits to the data. C, comparison of the maximal MG channel currents (Imax) in response to pressure pulses in cell-attached membrane patches with standard pipette solution (100 mm KCl, 5 mm Hepes-KOH) with and without 100 μM FFA. D, single MG channel I–V relations measured in standard pipette solution with and without 200 μM FFA or 200 μM NFA present.