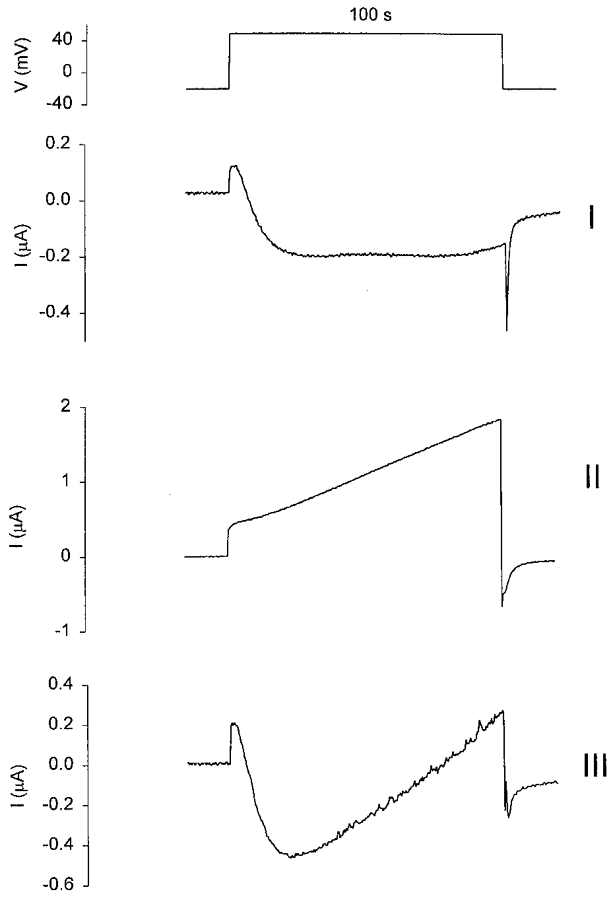
Figure 5. Three types of depolarization-activated current waveforms recorded in different oocytes.

The upper panel shows a depolarizing pulse of 100 s. The holding potential was stepped from −20 mV to +50 mV and then stepped back to −20 mV. I, II and III are the three types of current waveforms that are seen in different oocytes (67 oocytes, 3 frogs) recorded in NR.
