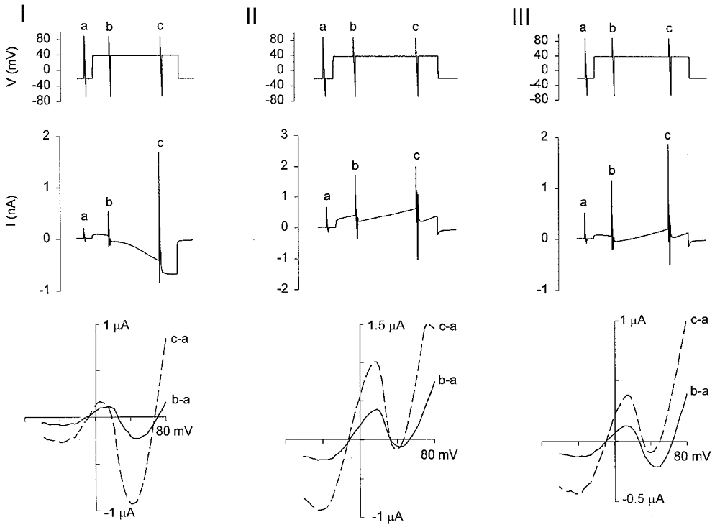
Figure 6. Current-voltage relations of the three currents (I, II and III) similar to those shown in Fig. 5.

The upper panel of each figure is the voltage protocol. The holding potential was stepped from −20 mV to +50 mV for 100 s and then stepped back to −20 mV. Voltage ramps were applied before and within each depolarizing pulse. Each recording was obtained from a different oocyte in NR. The middle panels show the currents and the lower panels show the I–V relations of the 2nd (b–a, continuous lines) and 3rd (c–a, dashed lines) voltage ramps minus the I–V curves of the 1st ramps (a).
