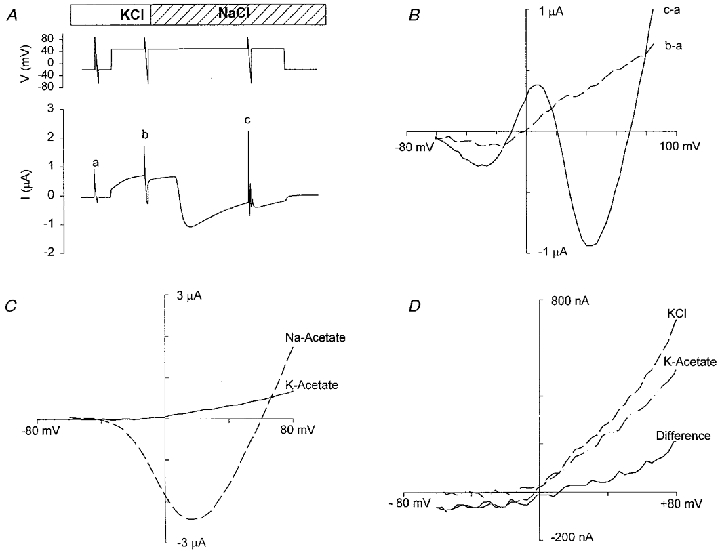
Figure 7. Depolarization-activated currents and I–V relations in different bathing solutions.

A, membrane potential and current recordings when 100 mm K+ in Ringer solution was replaced by 100 mm Na+ (NR). Top trace is the voltage protocol (depolarization pulse from −30 mV to +50 mV for 100 s). Voltage ramps of 1.5 s were applied before (a) and during (b and c) the 120 s depolarizing pulse. Bottom trace is current recording. B, I–V relations measured by the second (b–a; dashed line) and the third (c–a; continuous line) ramps after subtraction of the current of the first ramp (a). C, I–V relations of the depolarization-activated currents in 120 mm potassium acetate and 120 mm sodium acetate solution. D, I–V relations of depolarization-activated currents in 120 mm KCl, 120 mm potassium acetate solution and their difference current (KCl – potassium acetate). Each solution had a pH of 7.5, adjusted with Hepes.
