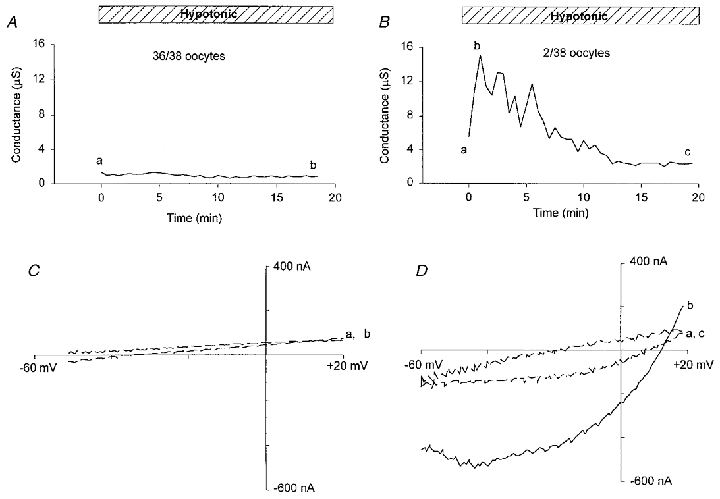
Figure 11. Hypotonicity-induced conductance and its I–V relation.

A and B, membrane conductance induced by hypotonicity (63 mosmol l−1, 25 %) in two different oocytes, with A illustrating the lack of response shown by most oocytes and B the response seen in 2 out of 38 oocytes. C and D, I–V relations measured by voltage ramps before, at the peak, and at the end of the conductance induction in A and B. The continuous lines are I–V relations measured at the peak of the conductance. The dashed lines are I–V relations measured before and after exposure to hypotonic solution.
