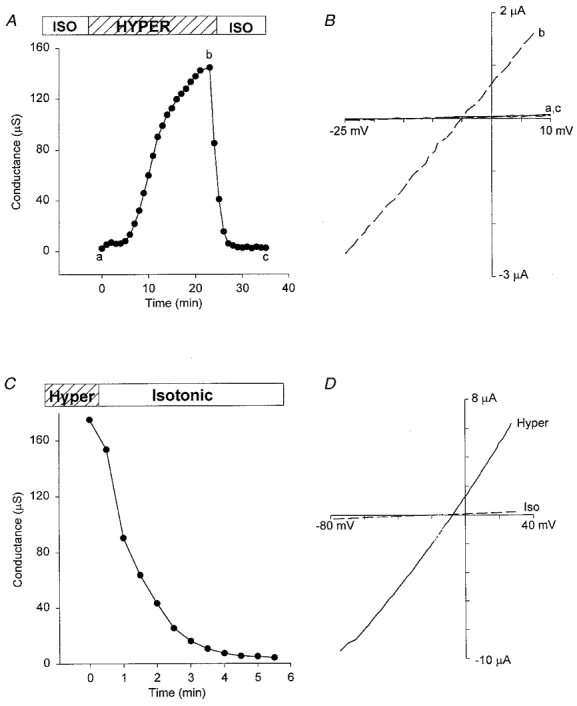
Figure 12. Hypertonicity-induced conductance.

A, a reversible conductance increase induced by hypertonic (480 mosmol l−1, 200 %) solution for a typical oocyte response. B, I–V relations measured by voltage ramps before, at the peak, and at the end of the conductance increase induced in A. Dashed line is the I–V relation measured at the peak of the conductance (b) and the continuous lines (a,c) are the I–V relations measured before exposure to hypertonic solution and after returning to isotonic solution. C, conductance of a pre-shrunk oocyte that was deactivated by returning to isotonic solution. D, I–V relations of membrane conductance in the pre-shrunk oocyte in hypertonic (continuous lines) and isotonic (dashed lines) solutions. Hypertonic solution contained (mm): 120 KCl, 2 CaCl2, 260 mannitol, 5 Hepes-KOH (pH 7.2). Isotonic solution had the same ionic composition but no mannitol was added.
