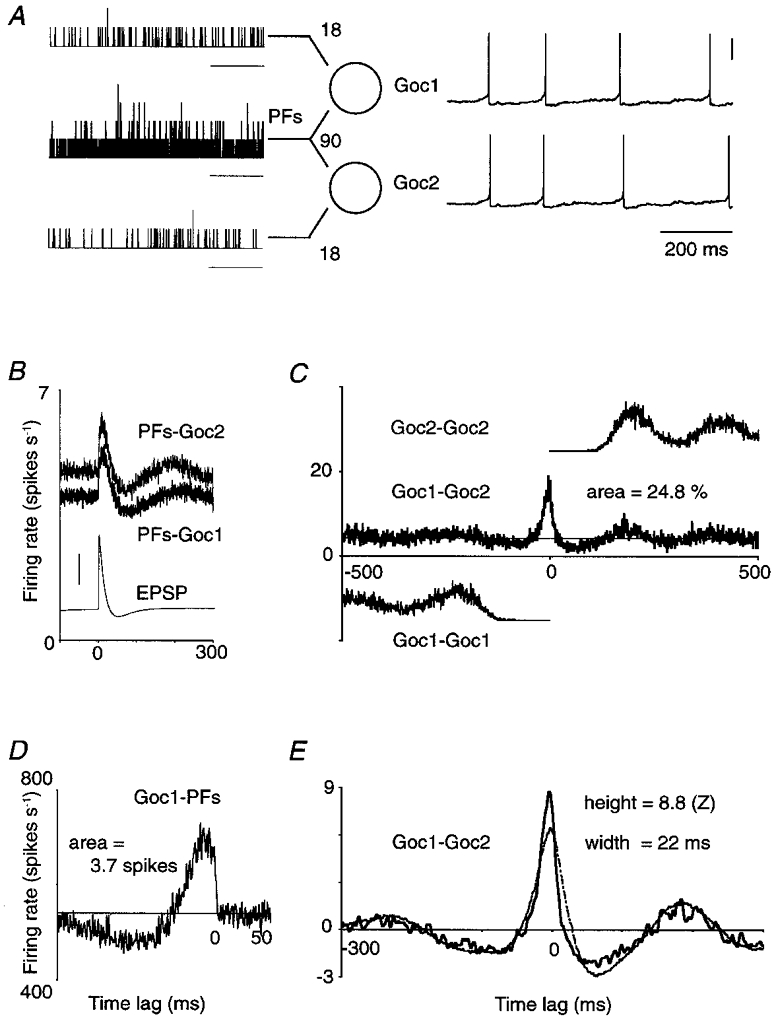
Figure 1. Cross-correlation analysis of model Golgi cell responses.

A, two Golgi cells (Goc1 and Goc2) which each receive input from 108 parallel fibres (PFs). Of the set of afferents, 90 PFs make synapses on both Golgi cells. The spike train histograms on the left, compiled for illustration only, show in 1 ms bins the number of spikes selectively conveyed by 18 PFs to Goc1 (upper trace), by 18 other PFs to Goc2 (lower trace) and by the joint set of 90 PFs to both Golgi cells (middle trace). Three of the four spikes which Goc1 and Goc2 fired during this input pattern were almost synchronous (membrane potential traces on right; vertical scale bar, 0.2 V). To calculate the cross-correlation histograms (CCHs) in B-E, a mean firing rate of 5 spikes s−1 was maintained in each PF for 1200 s, yielding a record of 4847 ‘spontaneous’ spikes in Goc1 (mean firing rate, 4.04 spikes s−1; resting potential, −63.3 mV) and 5679 spikes in Goc2 (4.73 spikes s−1; resting potential, −62.8 mV). Horizontal scale bars in A, 200 ms. Horizontal axes in B-E, time lag (ms). B, PFs-Goc1: non-smoothed CCH between the entire set of 108 PFs afferent to Goc1, and Goc1; PFs-Goc2: same for Goc2. Vertical axis, Golgi cell firing rate. The thin trace is a unitary EPSP (holding potential, −68 mV; vertical scale bar, 0.2 mV). C, Goc1-Goc2: non-smoothed CCH between Goc1 and Goc2, expressed as Goc2 firing rate. The central peak is a few milliseconds offset to the left because Goc2 fired faster than Goc1, due to its less negative resting membrane potential. The peak area, integrated above the mean (thin horizontal line), measured 0.248 spikes indicating that a quarter of the spikes were synchronous. Goc1-Goc1 and Goc2-Goc2: vertically offset, one-sided autocorrelograms. D, Goc1-PFs: non-smoothed CCH between Goc1 and its population of 108 afferent PFs. Vertical axis, firing rate of the PF population; area above the mean in absolute spike count, 3.7 spikes. E, thick curve is the CCH of C after smoothing and normalization. Thin curve is the predicted CCH obtained, after smoothing and normalization, by cross-correlating the CCHs labelled PFs-Goc1 and PFs-Goc2 from B.
