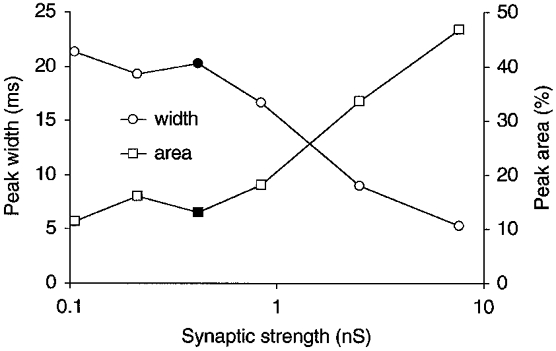
Figure 3. Peak width decreases, and area increases, with the strength of PF synapses.

The width (○) and area (□) of the central peak on the CCH between a pair of model Golgi cells are compared for configurations with different strengths of PF synapses. The peak conductance of a single PF synapse was varied from 105.3 pS to 7.6 nS, but the firing rate of Golgi cells was held approximately constant by varying in inverse proportion the number of PF afferents (from 432 to 6). All PFs fired at 5 spikes s−1 and made AMPA receptor synapses. Five-sixths of the synapses were shared with the other Golgi cell of the pair. Peak width was measured on smoothed CCHs. The data points at 421 pS (filled symbols) represent the 108 AMPA configuration of Fig. 2, in which the EPSC size measured 28.4 pA, which is similar to the size of EPSCs recorded in vitro in rat Golgi cells (Dieudonné, 1998).
