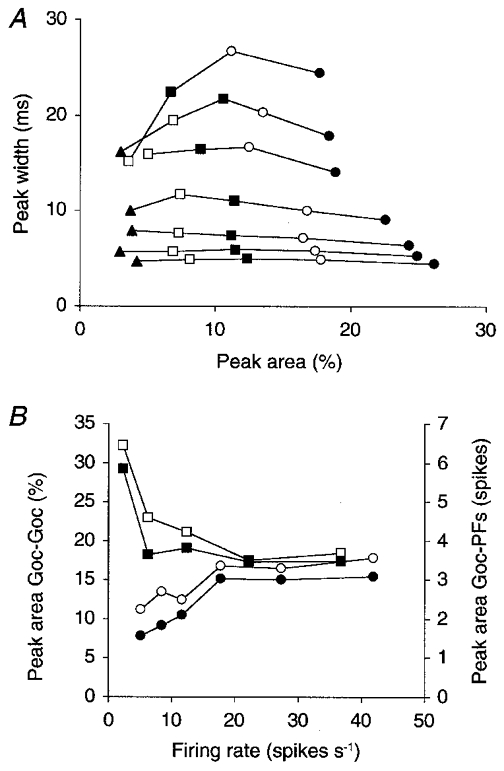
Figure 4. Peak area, not peak width, depends on the degree of common input.

A, the data for the 108 AMPA configuration of Fig. 2A and C are completed with data for the same configuration but from Golgi cell pairs with lower and higher degrees of input overlap. Each curve was generated with a different PF firing rate (increasing from the upper to the lower curve); the resultant mean Golgi cell firing rates measured 5.1 (uppermost curve), 8.5, 11.7, 17.7, 27.4, 35.3 and 41.9 spikes s−1 (lowermost curve). Different symbols represent pairs with different percentages of shared input. Of the 108 PF afferents to each Golgi cell, the number shared with the other Golgi cell of a pair was 108 (•), 90 (○, same data points as in Fig. 2A and C), 72 (▪), 54 (□), or 36 (▴). All data points are mean values of the central peak sizes measured on more than 20 CCHs (see Methods). When the percentage of shared afferents was small, not all CCHs showed a central peak. Data are therefore shown only for those parameter conditions in which at least half of the CCHs had a central Z-value > 3. B, the area of the central peak on the CCH is plotted versus the mean Golgi cell firing rate for the pairs with 90 shared afferents from A (○, same data). Hyperpolarizing the model Golgi cells by using more negative reversal potentials for their leak currents (Eleak between −80 and −75 mV instead of −70 and −60 mV) suppressed all spontaneous activity and increased peak area selectively at the lowest firing rates (□). The corresponding areas of the peaks on the CCHs between Golgi cells and their afferent PFs are plotted in filled symbols (right vertical axis; see Fig. 1D for measurement of this peak area).
