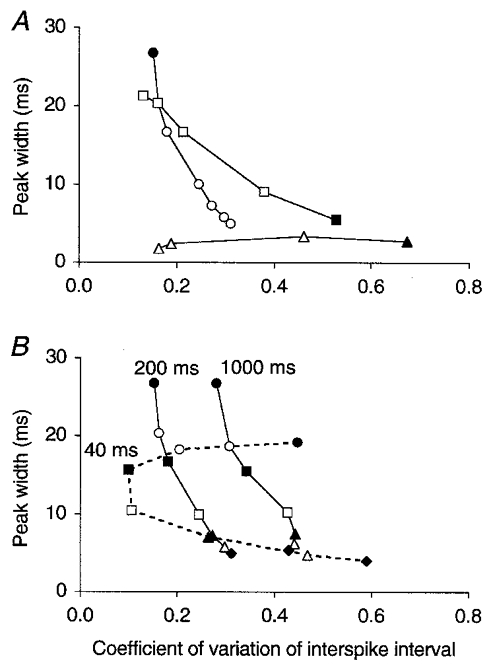
Figure 5. Regular firing favours, but is not necessary for, loose synchronization.

Relationship between the regularity of firing of model Golgi cells (coefficient of variation of the interspike interval, c.v.) and the precision of their synchronization (the width of the central peak on the CCH). The c.v. was calculated as standard deviation of interspike interval/mean interspike interval, averaged over > 20 Golgi cells (see Methods). A, data obtained by varying the strength of a PF synapse (and in inverse proportion the number of PF afferents) at a constant PF firing rate of 5 spikes s−1 (squares; ▪ for lowest number, i.e. 6 synapses per Golgi cell; data from Fig. 3) or by varying the PF firing rate in the 108 AMPA configuration (circles; • for lowest firing rate; data from Fig. 2A). The triangles represent data points from Golgi cells with granule cell dynamics (see Methods) in the 108 AMPA configuration and at increasing PF firing rates (▴ for lowest firing rate; non-smoothed CCHs; synaptic strength needed to be taken 4 times larger to compensate for the increased firing threshold). B, reference curve of the 108 AMPA configuration copied from A (200 ms, middle curve), together with data obtained after the decay time constant of the [Ca2+]i of Golgi cells had been increased 5 times (1000 ms, right curve) or decreased (40 ms, left dashed curve). Symbols represent different PF firing rates. Varying the time constant of [Ca2+]i changed the excitability and hence the firing rate of Golgi cells compared to the reference curve, which was compensated for by adjusting the peak conductance of the Ca2+-dependent K+ channel for each particular condition. Owing to this, the same symbols on different curves also represent similar Golgi cell firing rates: about 5, •; 8, ○; 11, ▪; 17, □; 27, ▴; 34, ▵; and 41 spikes s−1, ♦.
