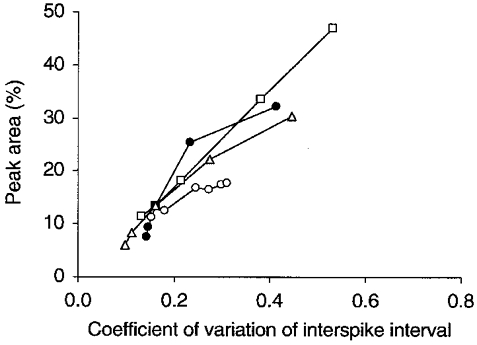
Figure 6. Irregular firing favours spike synchronization.

The area of the central peak on the CCH between a pair of model Golgi cells is plotted versus the mean coefficient of variation of the interspike interval of Golgi cells (see legend to Fig. 5). Starting from a standard configuration with 108 PF afferents to each Golgi cell and a PF firing rate of 5 spikes s−1, the curves were generated by varying (1) the PF firing rate (○), (2) the strength of a single PF synapse and in inverse proportion the number of PF afferents (□), (3) the strength of a PF synapse for a fixed number of 108 PF afferents (▵) or (4) the Golgi cell resting membrane potential (•). Peak area increases when the PF firing rate increases (○), when the strength of a PF synapse increases (□ and ▵) and when the resting potential is more negative (•). The resultant Golgi cell firing rates varied between 5.1 and 41.9 spikes s−1 (○), between 8.4 and 13.1 spikes s−1 (□), between 5.6 and 20.2 spikes s−1 (▵) and between 16.9 and 2.4 spikes s−1 (•).
