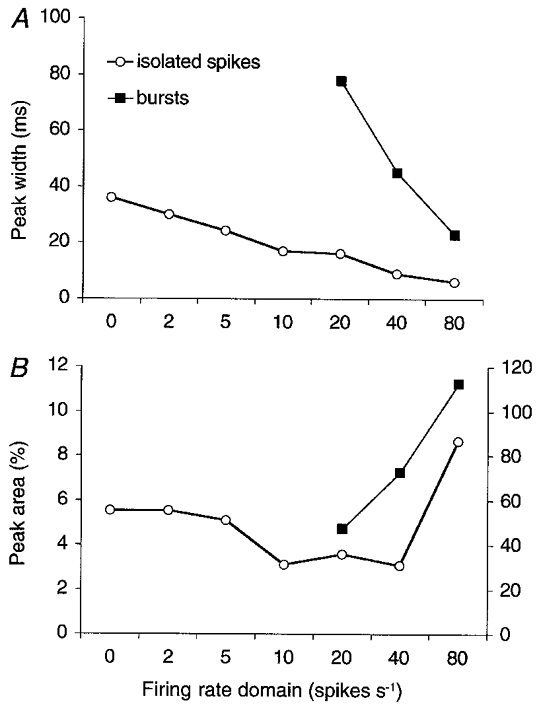
Figure 8. Two mechanisms of loose synchronization operate in separate firing rate domains.

A, plots of the width of the central peak on the high-pass filtered CCHs of Fig. 7B–H (○) and on the non-filtered CCHs of Fig. 7F–H (▪). The two resulting curves are presumed to represent the effect of firing rate on two different mechanisms of loose synchronization: common monosynaptic PF excitation (○) and burst firing or rate covariance (▪). B, the corresponding peak areas. Square data points read on right vertical axis. Note that the horizontal axes in A and B are non-linear and that the labels indicate the lower boundaries of the disjunct firing rate windows.
