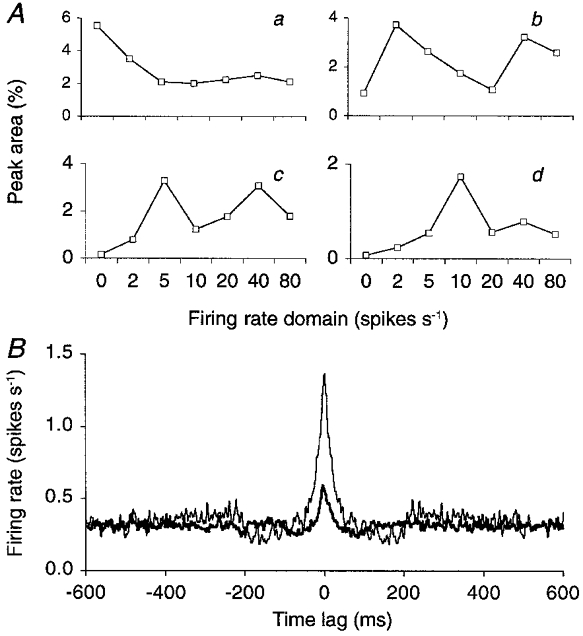
Figure 9. Cerebellar Golgi neurons with similar firing rates synchronize more easily.

The experimentally recorded spike trains of a pair of Golgi cells were decomposed independently according to their instantaneous firing rates, to yield two sets of seven spike trains selective to disjunct firing rate domains (see Methods, data cumulated over all Golgi cell pairs). A, the resultant seven spike trains of the second Golgi cell are represented on the horizontal axes, and ranked by the firing rate domain to which their spikes belong. They were cross-correlated one by one with the firing rate-selective spike trains of the first Golgi cell. The four curves plot, for the lowest four firing rate domains of the first Golgi cell, the area of the central peak on the resultant CCH. The firing rate domains of the first Golgi cell are: < 2 spikes s−1 (a), 2–5 spikes s−1 (b), 5–10 spikes s−1 (c) and 10–20 spikes s−1 (d). At the highest three firing rate domains, rate covariance caused the central peak to increase in area again. B, the spike train containing the spikes of the 2–5 spikes s−1 firing rate window of the second Golgi cell was cross-correlated with the spike train of the first Golgi cell representing the same firing rate domain (thin curve) or the 5–10 spikes s−1 firing rate window (thick curve). In each curve the spikes from the first Golgi cell were used as reference spikes. Hence the two CCHs plot the rate of the same spikes of the second neuron (2–5 spikes s−1) around the spikes belonging to two different firing rate windows of the first neuron. Peak area was 4.7 times larger when the two Golgi cells fired at the same rate (2–5 spikes s−1; 3.71 %versus 0.79 %). Peak width measured 29 ms (thin curve) and 26 ms (thick curve). Smoothed CCHs without high-pass filtering.
