
Figure 6. Typical recordings of MG channel activities in membrane patches formed on control, blebbed and vesicular membrane.
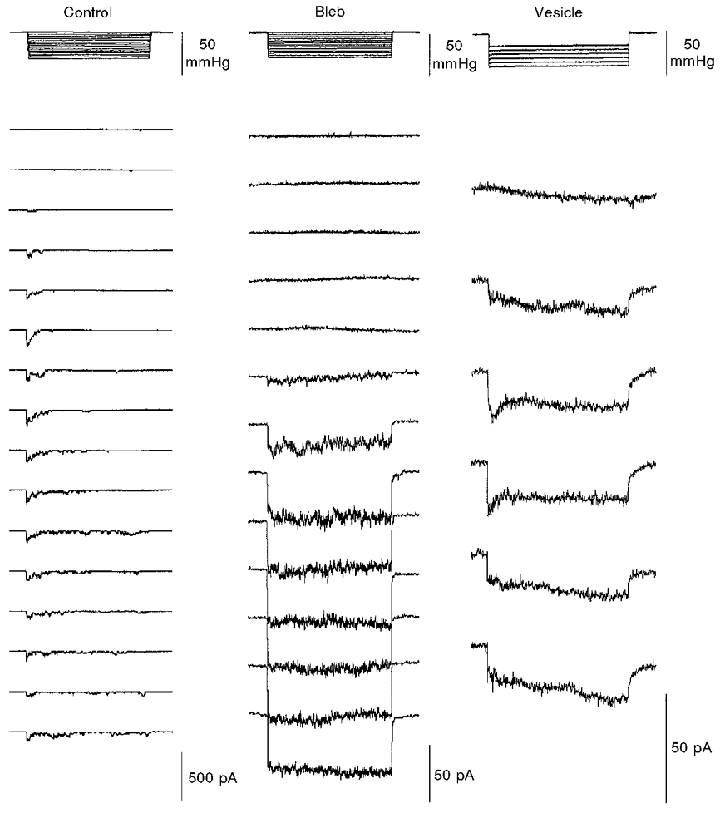
Incremental pressure pulses of 4 s were applied (upper panel) to activate the current responses shown in the lower panel. The membrane potential in all cases was set at −100 mV (from the measured MG current reversal potential). Note the different current scales in the three conditions.