
Figure 7. Stimulus-response relations of the MG channels in control, blebbed and vesicular membrane.
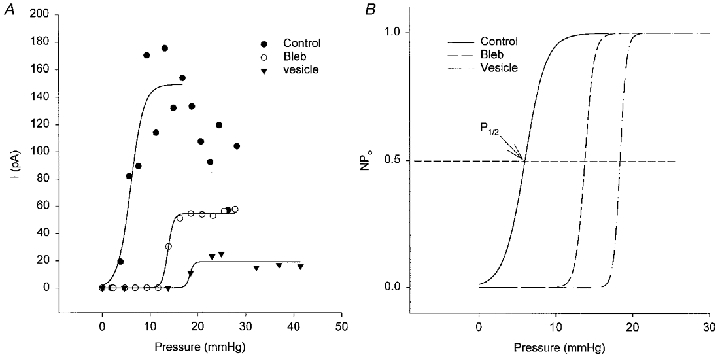
A, symbols show peak MG channel currents measured from the currents in Fig. 6 as a function of applied pressure. The lines were obtained by fitting these values to Boltzmann relations. B shows normalized Po-pressure relations. As indicated in B, half-activation pressure (P1/2) represents the pressure at which Po reaches 0.5.