
Figure 10. Images and MG current recordings of a membrane patch in response to repetitive mechanical stimulation.
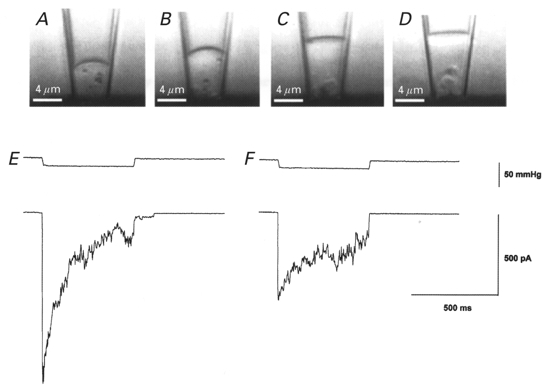
The top panels (A–D) show video images of a cell-attached patch at different times after the formation of the tight seal and the bottom panels (E and F) show the current response at the time of image A and D, respectively. Between each image, short (100 ms) suction and pressure step protocols were applied (not shown). A, the first image taken soon after seal formation shows the patch slightly curved and located close (≈5 μm) to the cell surface. Particles located in the cytoplasm displayed no motion presumably because they were immobilized on cytoskeleton structures. B-D, with repetitive stimulus protocols, the patch progressively moved up the pipette away from the cell and a clear space (most evident in D) developed between the membrane and cytoskeleton structures remaining close to the cell. Cytoplasmic particles that moved into this clear space displayed Brownian motion indicating the absence of constraining structures (see also Sokabe & Sachs, 1990). E, application of a pressure pulse at the time of image A caused a rapid increase in MG channel activity that then adapted (i.e. closed) in the presence of sustained stimulation. F, application of the same pressure pulse at the time of image D caused activation of a smaller response that showed reduced adaptation. The patch pipette tip diameter was ≈4 μm.