
Figure 1. Action spectra from SCN neurones.
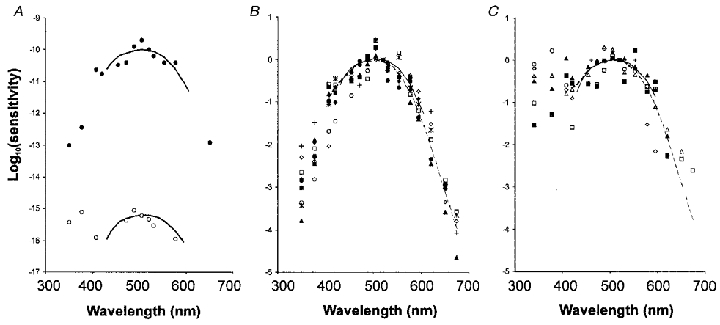
A, scotopic and photopic response sensitivity of a neurone in the SCN. Dartnall nomograms have been superimposed on the data points with a peak at 505 nm for the scotopic action spectrum (•) and 510 nm for the photopic action spectrum (○). The threshold for the photopic response is about 5 log units higher than the scotopic response threshold. The Y-axis is logarithmic. The scotopic threshold of about −10 corresponds to 10−10 photons m−2 s−1. B, data points for scotopic sensitivity from 10 different neurones arbitrarily normalised at the 520 nm value. For comparison, the Dartnall nomogram (continuous line, λmax≈505 nm) of the rat rhodopsin and the Lamb equation (dashed line) for the rat rhodopsin have been superimposed on the data points, with the 520 nm value equal to zero. C, data points for photopic sensitivity from 6 different neurones normalised at the 520 nm value. The Dartnall nomogram (continuous line, λmax≈510 nm) for the rat green cone opsin and the Lamb equation (dashed line) for the rat green cone opsin have been superimposed on the data points, with the 520 nm value equal to zero.