
Figure 2. Changes in physiological measures during control tasks and during effortful isometric exercise and effortful mental arithmetic (mental stress) tasks.
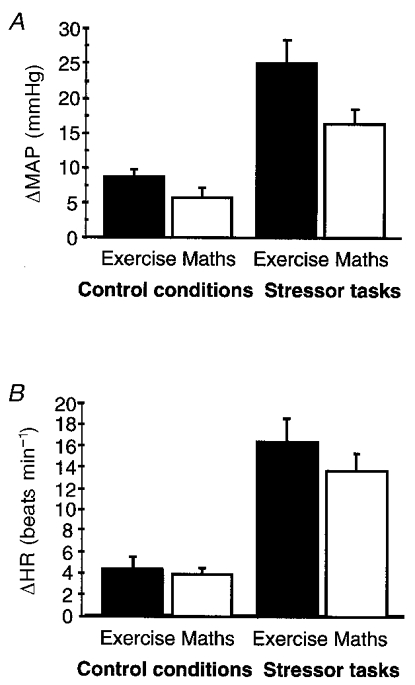
A, bar plot (means +s.d.) of changes in MAP (ΔMAP) for the 4 task conditions (increases in MAP from baseline during isometric exercise: effortful task, 24.9 ± 15.0 mmHg; effortless task, 8.5 ± 5.6 mmHg; P < 0.001, Student's t test; during mental arithmetic: effortful task, 16.2 ± 9.3 mmHg; effortless task, 5.6 ± 6.3 mmHg; P < 0.001). B, bar plot (means +s.d.) of changes in HR (ΔHR) for the 4 conditions (increases in HR from baseline during isometric exercise: effortful task, 16.2 ± 10.4 beats min−1; effortless task, 4.2 ± 5.6 beats min−1; P < 0.001; during mental arithmetic: effortful task, 13.6 ± 7.1 beats min−1; effortless task, 3.7 ± 2.9 beats min−1; P < 0.001).