
Figure 3. Inhibitory effect of DA on the evoked EPSCs in a VTA dopaminergic neurone.
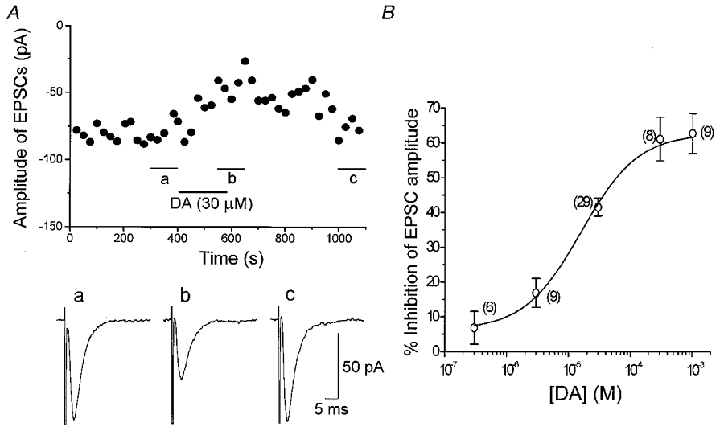
A, effect of DA (30 μM) on the EPSCs evoked at 0.2 Hz in the presence of bicuculline (20 μM), strychnine (0.5 μM) and D-AP5 (25 μM). The holding potential was −60 mV. Each point represents the mean amplitude of five consecutive responses evoked at 0.2 Hz. Traces a–c are the averaged traces of 30 responses evoked during the period indicated in the amplitude-time plot. B, concentration-response curve of DA-induced effect on the evoked EPSCs. Each point shows the mean ± s.e.m. obtained from the pooled data. The estimated IC50 value, maximum inhibition and Hill slope value were 16.0 μM, 62.8% and 0.95, respectively. The numbers of neurones are shown in parentheses.