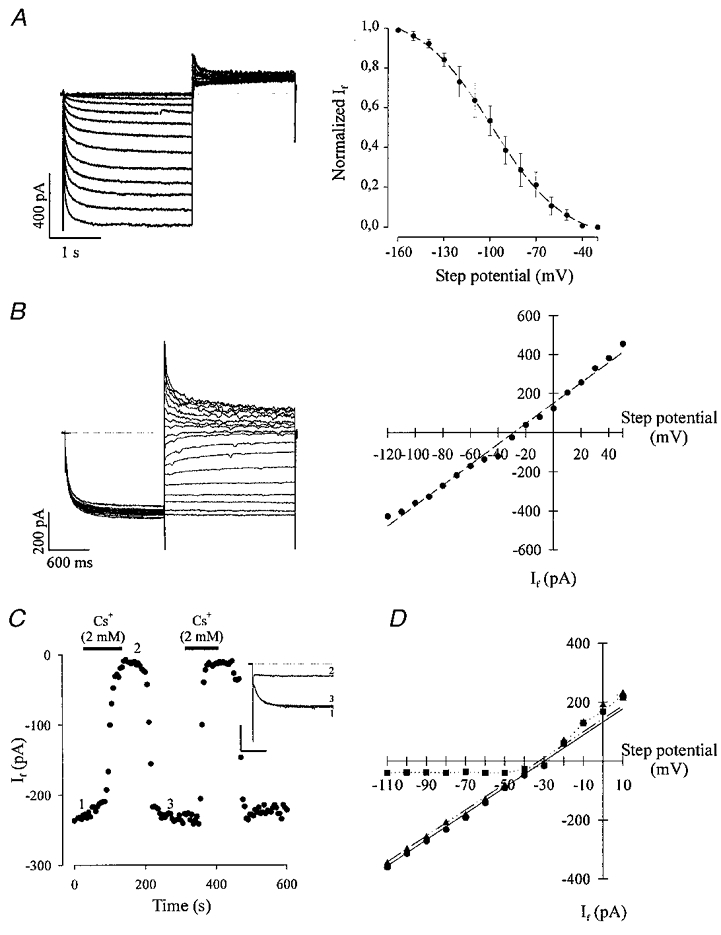
Figure 1. Biophysical and pharmacological characterization of If in ES cell-derived cardiomyocytes.

A, left panel, IDS cardiomyocyte displaying the steady-state activation characteristics tested by 2 s lasting hyperpolarizing voltage steps from −40 to −160 mV in 10 mV intervals and subsequent 2 s depolarization to +15 mV (holding potential −35 mV, the dotted line indicates the zero current level). The typical slow activation kinetics for If was observed, the threshold potential proved close to −50 mV. The right panel shows the steady-state activation characteristics of 3 representative experiments. Data points were obtained by measuring the peak of the deactivating tail currents, normalized and fitted with a Boltzmann curve yielding a Vh of −98.2 ± 1.1 mV. B, a representative I–V relationship of an EDS cardiomyocyte obtained by applying 2 s lasting prepulses to −115 mV (holding potential −35 mV) and subsequent 2 s lasting voltage steps ranging from −120 to +50 mV in 10 mV intervals. The I–V relationship (right panel) was determined by measuring If 15 ms after applying the depolarizing voltage steps. The linear regression of the data point yielded a reversal potential of −29 mV. C, extracellular application of Cs+ (2 mM) resulted in a complete block of If (holding potential −35 mV, step potential −110 mV) in an EDS cardiomyocyte; this could be reversed by washout (left panel). The numbers in the time course diagram indicate when the current traces displayed in the inset (calibration bars correspond to 300 ms and 200 pA, respectively) were recorded (the current in the presence of Cs+ was taken as reference value for the estimation of If amplitude). The right panel shows the I–V relation of If in absence and presence of extracellular Cs+ (2 mM) in an EDS cardiomyocyte. Cs2+ almost completely blocked If at potentials negative to the reversal potential (the linear regression yielded −30 mV prior to application of Cs+ and −32.5 mV after washout of Cs+) whereas positive to −30 mV no effect of Cs+ on If was observed (•, control; ▪, in the presence of 2 mM CsCl; ▴, after washout of CsCl).
