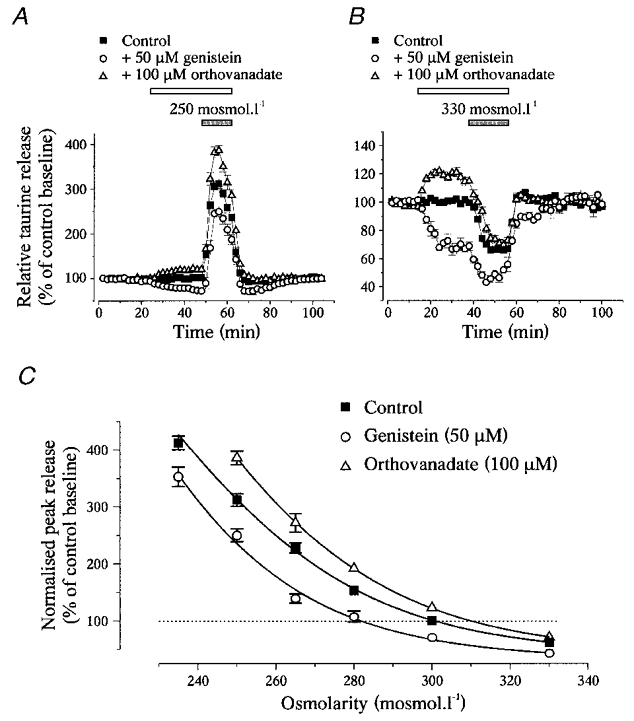
Figure 4. The level of tyrosine phosphorylation determines the osmosensitivity of taurine release.

A and B, effects of genistein and orthovanadate on taurine release during osmotic stimulation with a medium of 250 mosmol l−1 (A) and 330 mosmol l−1 (B). Note the different scales on the Y-axis in A and B. C, relationships between the peak amplitude of taurine release and medium osmolarity in the absence (▪) and presence of genistein (^) or orthovanadate (▵). Peak release is expressed as percentage of control baseline measured at 300 mosmol l−1 in the absence of the drug. Relationships were modelled with sigmoid curves (Boltzmann equation, continuous lines). Genistein and orthovanadate shift the relationship to the left and to the right, respectively. Number of observations is 3 or 4 for orthovanadate (except at 300 mosmol l−1 where it is 14), 4 or 5 for genistein (except at 300 mosmol l−1 where it is 22), and 4–10 for the control.
