
Figure 2. Supra-linear activation of ICRAC in the presence of moderate Ca2+ buffering.
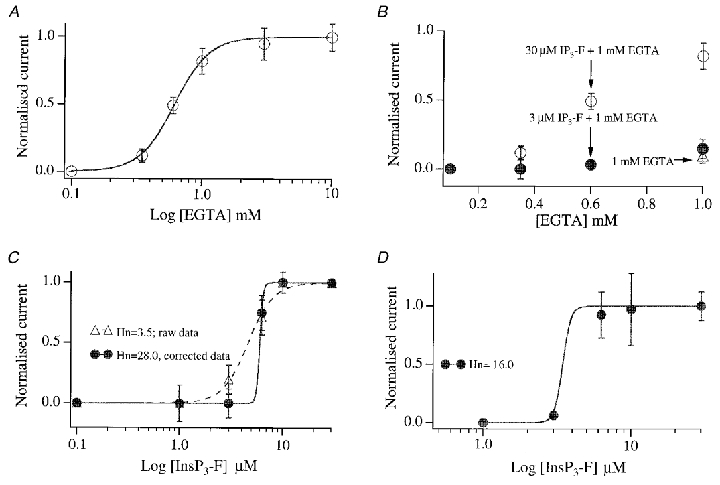
A, relationship between intra-pipette EGTA concentration and the amplitude of ICRAC (evoked by dialysis with 30 μM InsP3-F). Note that ICRAC was clearly submaximal in the presence of 0.6 mM EGTA. Each point is the mean ±s.e.m. of at least 5 cells. B, graph showing the relationship between EGTA concentration and size of ICRAC when the threshold dose of 3 μM InsP3-F (IP3-F) was used. Data for 30 μM have been included for comparison. The EGTA concentration ranged from 0.1 to 1.0 mM (each point is the mean ±s.e.m. of at least 5 cells and error bars are within the circles). The open triangle that overlaps with the filled circle at 1 mM is the size of ICRAC seen following dialysis with 1 mM EGTA and no InsP3-F. C, summary of pooled results when cells were dialysed with different concentrations of InsP3-F in the presence of 1 mM EGTA. Each point is the mean ±s.e.m. of at least 5 cells. Depending on how we treated the response to 3 μM InsP3-F, two different fits were obtained. If we included the size of ICRAC with 1 mM EGTA alone (-0.3 ± 0.11 pA pF−1), and then subtracted this value from the amplitudes seen when different concentrations of InsP3-F were included, we obtained the dashed fit (raw data). However, if we arbitrarily set the amplitude of ICRAC to zero for 3 μM InsP3-F (because there was no significant difference between 1 mM EGTA alone and 3 μM InsP3-F + 1 mM EGTA), and subtracted the value for 3 μM InsP3-F + 1 mM EGTA from the currents seen with higher concentrations of InsP3-F, then we obtained the continuous fit (corrected data). The dashed fit is an underestimate, whereas the continuous one is an overestimate, of the true Hill coefficient (Hn). D, graph summarising the InsP3-F concentration-ICRAC relationship in the presence of 0.6 mM EGTA. Whereas the majority of cells failed to generate a current to 3 μM InsP3-F + 0.6 mM EGTA or 0.6 mM EGTA alone, two cells from one preparation did generate a clear ICRAC to 3 μM InsP3-F (-1.5 and −1.2 pA pF−1). In this same preparation, 0.6 mM EGTA also produced a current rapidly (-1.0 pA pF−1). Because this was so uncharacteristic, we did not include any cells from this preparation.